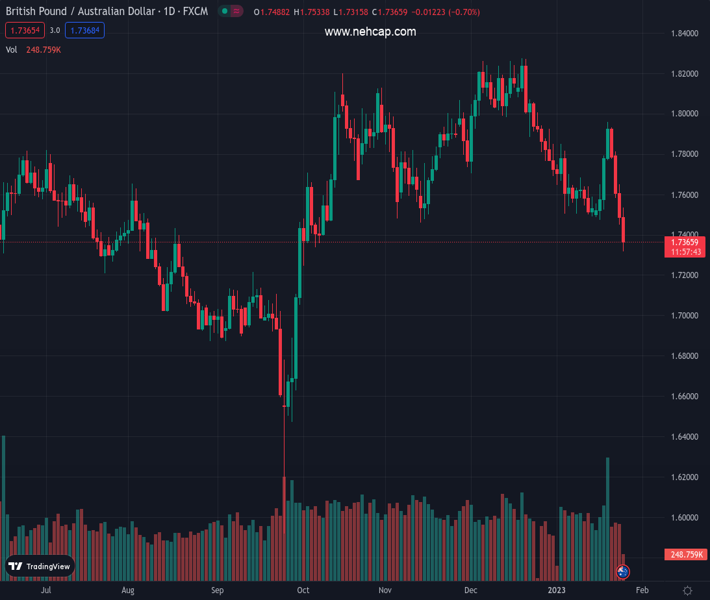
#GBPAUD @ 1.73576 prolongs its bearish trend for the fourth straight day and dives to a multi-month low. (Pivot Orderbook analysis)
…
This is a premium post.
[s2If !current_user_can(access_s2member_level4)]Please register for PREMIUM VERSION HERE to read full post below containing analysis. In case of any error or you think you are not able to read the full post below, please email us at support#nehcap.com [lwa][/s2If] [s2If current_user_can(access_s2member_level4)]
- GBP/AUD prolongs its bearish trend for the fourth straight day and dives to a multi-month low.
- A convincing break below the 200-day SMA and the 1.7500-1.7480 zone favours bearish traders.
- A slightly oversold RSI on hourly charts warrants caution before positioning for further downfall.
The pair currently trades last at 1.73576.
The previous day high was 1.7651 while the previous day low was 1.745. The daily 38.2% Fib levels comes at 1.7527, expected to provide resistance. Similarly, the daily 61.8% fib level is at 1.7574, expected to provide resistance.
The GBP/AUD cross extends its recent sharp downfall from the 1.8000 neighbourhood and remains under heavy selling pressure for the fourth straight day on Wednesday. The downward trajectory drags spot prices to a nearly four-month low during the first half of the European session, though stalls just ahead of the 1.7300 round-figure mark.
The Australian Dollar’s relative outperformance against its British counterpart comes amid rising odds for an additional rate hike by the Reserve Bank of Australia (RBA) in February. The bets were lifted by stronger domestic consumer inflation figures released earlier this Wednesday, which showed that the headline CPI accelerated to the highest level since 1990 during the fourth quarter.
That said, a softer tone around the equity markets – amid looming recession risks – might keep a lid on any further gains for the risk-sensitive Aussie. Apart from this, speculations that elevated consumer inflation will maintain pressure on the Bank of England (BoE) to continue raising rates could lend some support to the GBP/AUD cross and help limit further losses, for the time being.
From a technical perspective, the overnight close below the very important 200-day SMA and Wednesday’s slump confirm a fresh bearish breakdown below the 1.7500-1.7480 horizontal support. This supports prospects for an extension of the ongoing depreciating move for the GBP/AUD cross. That said, the extremely oversold Relative Strength Index (RSI) on hourly charts warrants some caution.
Hence, it will be prudent to wait for some near-term consolidation or a modest rebound before traders start positioning for the next leg down. In the meantime, any attempted recovery is more likely to confront stiff resistance near the 1.7400 mark. Some follow-through strength, however, might trigger a short-covering rally and lift the GBP/AUD cross to the 1.7500 support breakpoint.
On the flip side, the daily swing low, just ahead of the 1.7300 round figure, now seems to protect the immediate downside. The next relevant support is pegged near the 1.7260-1.7255 zone, below which the GBP/AUD cross could accelerate the fall further towards the 1.7200 mark en route to the 1.7180-1.7175 horizontal support.
Technical Levels: Supports and Resistances
GBPAUD currently trading at 1.7355 at the time of writing. Pair opened at 1.7515 and is trading with a change of -0.91 % .
| Overview | Overview.1 | |
|---|---|---|
| 0 | Today last price | 1.7355 |
| 1 | Today Daily Change | -0.0160 |
| 2 | Today Daily Change % | -0.9100 |
| 3 | Today daily open | 1.7515 |
The pair remains strongly bearish on the daily time frame. It trades below the 20 SMA @ 1.7669, 50 SMA 1.7865, 100 SMA @ 1.7669 and 200 SMA @ 1.7567.
| Trends | Trends.1 | |
|---|---|---|
| 0 | Daily SMA20 | 1.7669 |
| 1 | Daily SMA50 | 1.7865 |
| 2 | Daily SMA100 | 1.7669 |
| 3 | Daily SMA200 | 1.7567 |
The previous day high was 1.7651 while the previous day low was 1.745. The daily 38.2% Fib levels comes at 1.7527, expected to provide resistance. Similarly, the daily 61.8% fib level is at 1.7574, expected to provide resistance.
Note the levels of interest below:
- Pivot support is noted at 1.7426, 1.7338, 1.7225
- Pivot resistance is noted at 1.7628, 1.774, 1.7829
| Levels | Levels.1 |
|---|---|
| Previous Daily High | 1.7651 |
| Previous Daily Low | 1.7450 |
| Previous Weekly High | 1.7962 |
| Previous Weekly Low | 1.7470 |
| Previous Monthly High | 1.8278 |
| Previous Monthly Low | 1.7692 |
| Daily Fibonacci 38.2% | 1.7527 |
| Daily Fibonacci 61.8% | 1.7574 |
| Daily Pivot Point S1 | 1.7426 |
| Daily Pivot Point S2 | 1.7338 |
| Daily Pivot Point S3 | 1.7225 |
| Daily Pivot Point R1 | 1.7628 |
| Daily Pivot Point R2 | 1.7740 |
| Daily Pivot Point R3 | 1.7829 |
[/s2If]
Join Our Telegram Group
")


