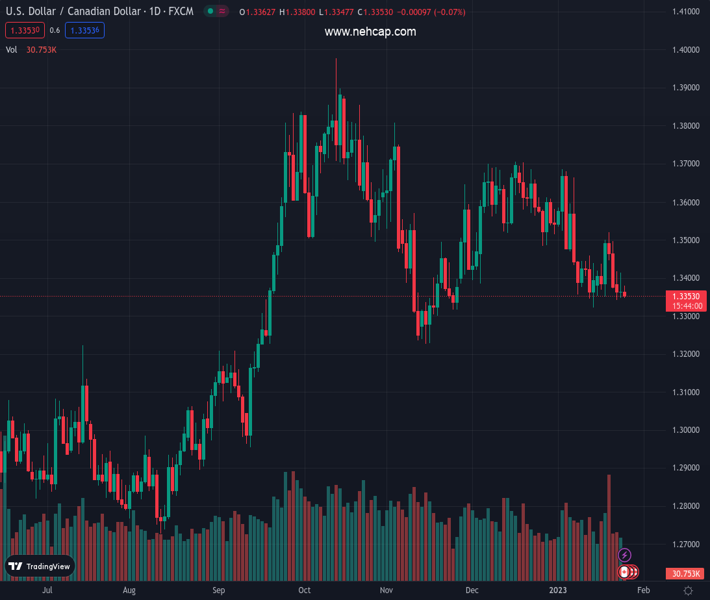
#USDCAD @ 1.33541 is set to extend the downside to near the weekly low around 1.3320. (Pivot Orderbook analysis)
…
This is a premium post.
[s2If !current_user_can(access_s2member_level4)]Please register for PREMIUM VERSION HERE to read full post below containing analysis. In case of any error or you think you are not able to read the full post below, please email us at support#nehcap.com [lwa][/s2If] [s2If current_user_can(access_s2member_level4)]
- USD/CAD is set to extend the downside to near the weekly low around 1.3320.
- Bank of Canada is expected to hike the interest rate further by 25 bps to 4.5%.
- The expectation of a smaller interest rate hike by the Federal Reserve is backed by escalating recession fears.
- USD/CAD is expected to deliver a breakdown of the Inverted Flag chart pattern that might expand volatility ahead.
The pair currently trades last at 1.33541.
The previous day high was 1.3414 while the previous day low was 1.3347. The daily 38.2% Fib levels comes at 1.3372, expected to provide resistance. Similarly, the daily 61.8% fib level is at 1.3388, expected to provide resistance.
USD/CAD is hovering near the critical support above 1.3340 in the early European session. The Loonie asset has dropped after failing to sustain above 1.3400 and is expected to decline further to near the weekly lows around 1.3320. The major is following the footprints of the US Dollar Index (DXY), which is displaying a subdued performance.
Weakness in the S&P500 futures led by a dip in Microsoft earnings due to missed estimates in the cloud business and technical glitches in the NYSE has turned investors’ risk-averse. Also, investors are restricting themselves from building full-capacity positions ahead of the United States Gross Domestic Product (GDP) data. The US Dollar Index (DXY) is struggling to sustain above the 101.50 resistance. The alpha created by the US government bonds has rebounded firmly. The 10-year US Treasury yields have scaled to near 3.47%.
To tame stubborn inflation, the Bank of Canada (BoC) might continue to tighten its monetary policy further. Canada’s inflation has been recorded at 6.3% from its December Consumer Price Index (CPI) report, which is three times more than the 2% inflation target.
According to a poll from Reuters, Bank of Canada Governor Tiff Macklem’s aggressive policy tightening campaign is expected to calm down as the street sees a further interest rate hike by 25 basis points (bps) to 4.50%. Also, it conveys that the Bank of Canada will keep interest rates at 4.5% for the rest of the year, which indicates that this might be the end of further policy tightening. Canada’s headline inflation stood at 6.3% for December and is expected to remain above 2% inflation target till Q3CY2024.
Factors that have kept Canada’s inflation at the rooftop are the tight labor market and supply chain bottlenecks. Upbeat employment opportunities have not provided a significant reason to producers to trim the prices of goods and services at factory gates. A higher-than-projected hawkish interest rate decision by the Bank of Canada might strengthen the Canadian Dollar.
Sheer weakness in the oil prices witnessed on Tuesday has met with demand in Wednesday morning around the critical support of $80.00. The black gold witnessed immense pressure as oil demand is expected to witness short-term pain due to extended holidays in Chinese markets for Lunar New Year celebrations. Also, the absence of chatters about supply cuts in the report from OPEC impacted the oil price.
Meanwhile, the oil price has attempted a recovery amid headlines that the United States is considering refilling the Strategic Petroleum Reserve (SPR). US President Joe Biden exploited the oil reserves to fight rising oil prices in CY2022. It is worth noting that Canada is a leading exporter of oil to the United States and a recovery in the oil price might support the Canadian Dollar.
After a better-than-projected preliminary United States S&P PMI data, investors are shifting their focus toward the release of Thursday’s Gross Domestic Product (GDP). The street is expecting the fourth quarter GDP at 2.8% vs. the prior release of 3.2%. Investors should be aware of the fact that the US Bureau of Economic Analysis reported negative growth in the first two quarters of CY2022. And further contraction in the fourth quarter might accelerate recession fears. The rationale behind softening of economic activities is the higher interest rates by the Federal Reserve (Fed), which has trimmed the leakage of borrowings due to higher interest obligations.
Apart from that, chatters about interest rate policy by the Federal Reserve are impacting the US Dollar. The street is expecting a further deceleration in the pace of policy tightening by the Federal Reserve as inflation has been softened significantly.
USD/CAD is forming an Inverted Flag chart pattern on an hourly scale that indicates a sheer consolidation, which is followed by a breakdown in the same. Usually, the consolidation phase of the chart pattern serves as an inventory adjustment in which those participants initiate shorts, which prefer to enter an auction after the establishment of a bearish bias.
Downward-sloping 20-and 50-period Exponential Moving Average (EMA) at 1.3365 and 1.3375 respectively are acting as a major barricade for the US Dollar.
Meanwhile, the Relative Strength Index (RSI) (14) is oscillating in a 40.00-60.00 range, which indicates volatility contraction.
Technical Levels: Supports and Resistances
USDCAD currently trading at 1.3358 at the time of writing. Pair opened at 1.3372 and is trading with a change of -0.1 % .
| Overview | Overview.1 | |
|---|---|---|
| 0 | Today last price | 1.3358 |
| 1 | Today Daily Change | -0.0014 |
| 2 | Today Daily Change % | -0.1000 |
| 3 | Today daily open | 1.3372 |
The pair is trading below its 20 Daily moving average @ 1.3467, below its 50 Daily moving average @ 1.3503 , below its 100 Daily moving average @ 1.3517 and above its 200 Daily moving average @ 1.3197
| Trends | Trends.1 | |
|---|---|---|
| 0 | Daily SMA20 | 1.3467 |
| 1 | Daily SMA50 | 1.3503 |
| 2 | Daily SMA100 | 1.3517 |
| 3 | Daily SMA200 | 1.3197 |
The previous day high was 1.3414 while the previous day low was 1.3347. The daily 38.2% Fib levels comes at 1.3372, expected to provide resistance. Similarly, the daily 61.8% fib level is at 1.3388, expected to provide resistance.
Note the levels of interest below:
- Pivot support is noted at 1.3341, 1.3311, 1.3275
- Pivot resistance is noted at 1.3408, 1.3444, 1.3475
| Levels | Levels.1 |
|---|---|
| Previous Daily High | 1.3414 |
| Previous Daily Low | 1.3347 |
| Previous Weekly High | 1.3521 |
| Previous Weekly Low | 1.3351 |
| Previous Monthly High | 1.3705 |
| Previous Monthly Low | 1.3385 |
| Daily Fibonacci 38.2% | 1.3372 |
| Daily Fibonacci 61.8% | 1.3388 |
| Daily Pivot Point S1 | 1.3341 |
| Daily Pivot Point S2 | 1.3311 |
| Daily Pivot Point S3 | 1.3275 |
| Daily Pivot Point R1 | 1.3408 |
| Daily Pivot Point R2 | 1.3444 |
| Daily Pivot Point R3 | 1.3475 |
[/s2If]
Join Our Telegram Group
")


