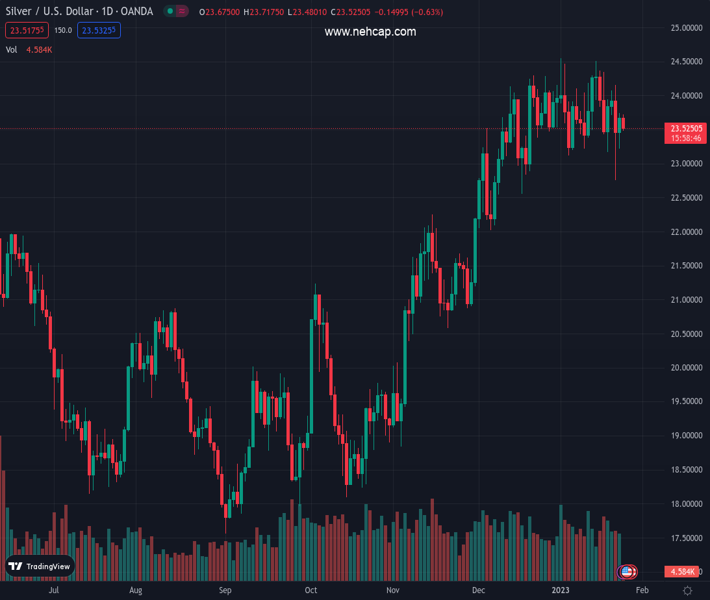
#XAGUSD @ 23.525 Silver traders take offers to refresh intraday low while paring previous daily losses. (Pivot Orderbook analysis)
…
This is a premium post.
[s2If !current_user_can(access_s2member_level4)]Please register for PREMIUM VERSION HERE to read full post below containing analysis. In case of any error or you think you are not able to read the full post below, please email us at support#nehcap.com [lwa][/s2If] [s2If current_user_can(access_s2member_level4)]
- Silver traders take offers to refresh intraday low while paring previous daily losses.
- DXY steadies during three-week downtrend as traders brace for US Q4 GDP.
- Inactive yields, light calendar adds to the market’s indecision ahead of key catalysts.
The pair currently trades last at 23.525.
The previous day high was 23.74 while the previous day low was 23.22. The daily 38.2% Fib levels comes at 23.54, expected to provide resistance. Similarly, the daily 61.8% fib level is at 23.42, expected to provide support.
Silver price (XAG/USD) remains depressed around intraday low of $23.50 as traders seek fresh clues to extend the fortnight-long downtrend during early Wednesday in Europe. In doing so, the bright metal takes clues from a pause in the US Dollar’s downtrend while reversing the previous day’s gains.
That said, the US Dollar Index (DXY) steadies around 102.00 as bears await the US Gross Domestic Product (GDP) for the fourth quarter (Q4) and the next week’s Federal Open Market Committee (FOMC) meeting.
It’s worth noting that the downbeat US activity data join the dovish concerns surrounding the Federal Reserve’s (Fed) next moves to keep XAG/USD buyers hopeful. However, an absence of Chinese traders and the pre-Fed blackout period joins the consolidation in the commodity markets, due to China’s Lunar New Year holidays, which seem to weigh on the Silver price of late.
Additionally, the market’s dicey moves and a lack of major data/events also probe the commodity traders. While portraying the mood, US Treasury bond yields remain inactive after Tuesday’s pullback while the S&P 500 Futures print mild losses but the stocks in the Asia-Pacific region trade mixed and support the currencies of the zone.
Moving on, Silver traders will pay close attention to the risk catalyst ahead of the US Q4 GDP as recession woes challenge the partially industrial commodity. However, major attention will be given to the next week’s Federal Open Market Committee (FOMC) meeting for clear directions.
To sum up, the Silver price remains on the bear’s radar for the day but the bulls are lurking ahead of the key data/events.
A sustained downside break of the seven-week-old ascending trend line, now immediate resistance near $23.70, keeps Silver bears hopeful of retesting the monthly low near $22.75.
Technical Levels: Supports and Resistances
XAGUSD currently trading at 23.51 at the time of writing. Pair opened at 23.66 and is trading with a change of -0.63% % .
| Overview | Overview.1 | |
|---|---|---|
| 0 | Today last price | 23.51 |
| 1 | Today Daily Change | -0.15 |
| 2 | Today Daily Change % | -0.63% |
| 3 | Today daily open | 23.66 |
The pair is trading below its 20 Daily moving average @ 23.77, above its 50 Daily moving average @ 23.05 , above its 100 Daily moving average @ 21.34 and above its 200 Daily moving average @ 21.03
| Trends | Trends.1 | |
|---|---|---|
| 0 | Daily SMA20 | 23.77 |
| 1 | Daily SMA50 | 23.05 |
| 2 | Daily SMA100 | 21.34 |
| 3 | Daily SMA200 | 21.03 |
The previous day high was 23.74 while the previous day low was 23.22. The daily 38.2% Fib levels comes at 23.54, expected to provide resistance. Similarly, the daily 61.8% fib level is at 23.42, expected to provide support.
Note the levels of interest below:
- Pivot support is noted at 23.34, 23.01, 22.81
- Pivot resistance is noted at 23.86, 24.07, 24.39
| Levels | Levels.1 |
|---|---|
| Previous Daily High | 23.74 |
| Previous Daily Low | 23.22 |
| Previous Weekly High | 24.51 |
| Previous Weekly Low | 23.17 |
| Previous Monthly High | 24.30 |
| Previous Monthly Low | 22.03 |
| Daily Fibonacci 38.2% | 23.54 |
| Daily Fibonacci 61.8% | 23.42 |
| Daily Pivot Point S1 | 23.34 |
| Daily Pivot Point S2 | 23.01 |
| Daily Pivot Point S3 | 22.81 |
| Daily Pivot Point R1 | 23.86 |
| Daily Pivot Point R2 | 24.07 |
| Daily Pivot Point R3 | 24.39 |
[/s2If]
Join Our Telegram Group
")


