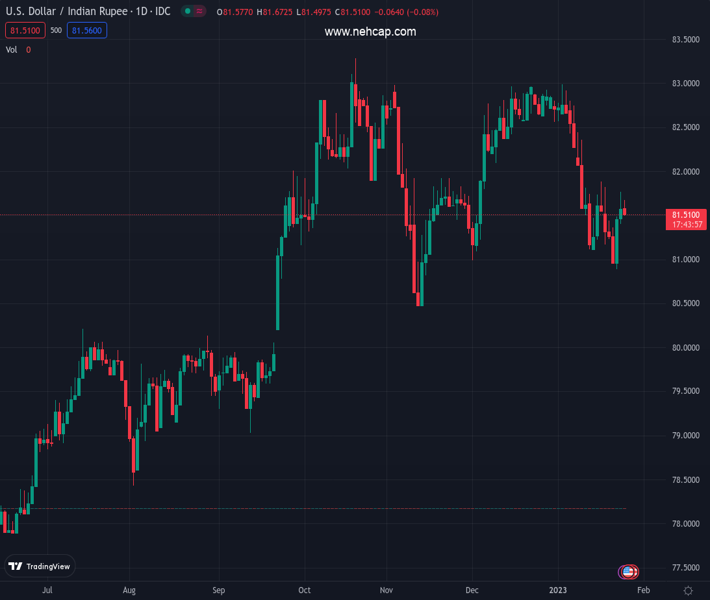
#USDINR @ 81.5510 retreats from weekly high, prints mild losses of late. (Pivot Orderbook analysis)
…
This is a premium post.
[s2If !current_user_can(access_s2member_level4)]Please register for PREMIUM VERSION HERE to read full post below containing analysis. In case of any error or you think you are not able to read the full post below, please email us at support#nehcap.com [lwa][/s2If] [s2If current_user_can(access_s2member_level4)]
- USD/INR retreats from weekly high, prints mild losses of late.
- Greenback remains depressed as US activities shrank for the seventh consecutive month.
- Cautious mood ahead of key data/events join sluggish yields, Oil price rebound to probe Indian Rupee buyers.
The pair currently trades last at 81.5510.
The previous day high was 81.7705 while the previous day low was 81.4115. The daily 38.2% Fib levels comes at 81.6334, expected to provide resistance. Similarly, the daily 61.8% fib level is at 81.5486, expected to provide support.
USD/INR bulls take a breather after a two-day uptrend amid Wednesday’s sluggish markets, refreshing intraday low near 81.50 at the latest. In doing so, the Indian Rupee (INR) pair traces the inactive yields, as well as the mixed performance of the US Dollar, amid a light calendar at home.
After reversing the two-day uptrend, the US Treasury bond yields remain sidelined as market players await fresh clues to confirm the recession woes. With this, the USD/INR pair portrays the cautious mood ahead of the US Gross Domestic Product (GDP) for the fourth quarter (Q4) and the next week’s Federal Open Market Committee (FOMC) meeting.
It should be noted that the US S&P Global PMIs moderated for January but failed to regain the 50.0 mark. That said, the Composite PMI for January increased to 46.6 from 45.0 prior and the 44.7 consensuses, marking the seventh consecutive below-50 figure.
With this, Fed fund futures signal the market’s receding hawkish bias. “Fed fund futures see only two more quarter-point rate hikes by the Fed to a peak of around 5% by June, before it starts cutting rates later in the year. The Federal Reserve itself has insisted it still has 75 bps of increases in the pipeline,” said Reuters.
As a result, the US Dollar Index (DXY) braces for the three-week downtrend despite being inactive around 102.00 as of late.
That said, the WTI crude oil prices also consolidate recent losses around $80.50, up half a percent to snap a two-day losing streak by the press time. As India relies on Oil imports and has a record Current Account Deficit (CAD), the higher Oil price weighs on the INR.
Amid these plays, the S&P 500 Futures print mild losses but the stocks in the Asia-Pacific region trade mixed and support the currencies of the zone.
Moving on, a light calendar challenges USD/INR moves while Thursday’s US Q4 GDP will be crucial for near-term directions. Following that, Friday’s opening of Adani Enterprise Initial Public Offering (IPO) from India will be important to gauge foreign inflows that seemed to have favored INR bulls of late. It’s worth observing, however, that the next week’s Federal Open Market Committee (FOMC) meeting is the most important event for the pair traders to watch for clear directions.
With the latest pullback, the USD/INR pair marks another failure to cross the 100-DMA, around 81.80 by the press time, which in turn favors the odds of witnessing a fresh monthly low, currently around 80.90.
Technical Levels: Supports and Resistances
USDINR currently trading at 81.5285 at the time of writing. Pair opened at 81.6123 and is trading with a change of -0.10% % .
| Overview | Overview.1 | |
|---|---|---|
| 0 | Today last price | 81.5285 |
| 1 | Today Daily Change | -0.0838 |
| 2 | Today Daily Change % | -0.10% |
| 3 | Today daily open | 81.6123 |
The pair is trading below its 20 Daily moving average @ 81.9545, below its 50 Daily moving average @ 82.0605 , below its 100 Daily moving average @ 81.7633 and above its 200 Daily moving average @ 80.13
| Trends | Trends.1 | |
|---|---|---|
| 0 | Daily SMA20 | 81.9545 |
| 1 | Daily SMA50 | 82.0605 |
| 2 | Daily SMA100 | 81.7633 |
| 3 | Daily SMA200 | 80.1300 |
The previous day high was 81.7705 while the previous day low was 81.4115. The daily 38.2% Fib levels comes at 81.6334, expected to provide resistance. Similarly, the daily 61.8% fib level is at 81.5486, expected to provide support.
Note the levels of interest below:
- Pivot support is noted at 81.4257, 81.2391, 81.0667
- Pivot resistance is noted at 81.7847, 81.9571, 82.1437
| Levels | Levels.1 |
|---|---|
| Previous Daily High | 81.7705 |
| Previous Daily Low | 81.4115 |
| Previous Weekly High | 81.8865 |
| Previous Weekly Low | 80.9595 |
| Previous Monthly High | 84.2500 |
| Previous Monthly Low | 80.9855 |
| Daily Fibonacci 38.2% | 81.6334 |
| Daily Fibonacci 61.8% | 81.5486 |
| Daily Pivot Point S1 | 81.4257 |
| Daily Pivot Point S2 | 81.2391 |
| Daily Pivot Point S3 | 81.0667 |
| Daily Pivot Point R1 | 81.7847 |
| Daily Pivot Point R2 | 81.9571 |
| Daily Pivot Point R3 | 82.1437 |
[/s2If]
Join Our Telegram Group
")


