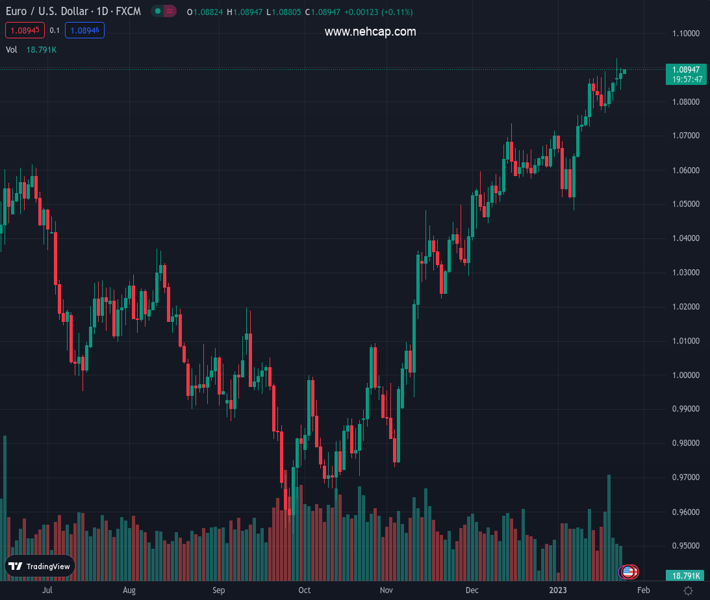
#EURUSD @ 1.08926 grinds higher during five-week winning streak, steadies of late., @nehcap view: Further upside expected (Pivot Orderbook analysis)
…
This is a premium post.
[s2If !current_user_can(access_s2member_level4)]Please register for PREMIUM VERSION HERE to read full post below containing analysis. In case of any error or you think you are not able to read the full post below, please email us at support#nehcap.com [lwa][/s2If] [s2If current_user_can(access_s2member_level4)]
- EUR/USD grinds higher during five-week winning streak, steadies of late.
- Bullish chart pattern, sustained bounce off 50-SMA joins upbeat RSI to keep buyers hopeful.
- Sellers need to conquer monthly support to retake control.
The pair currently trades last at 1.08926.
The previous day high was 1.0898 while the previous day low was 1.0835. The daily 38.2% Fib levels comes at 1.0874, expected to provide support. Similarly, the daily 61.8% fib level is at 1.0859, expected to provide support.
EUR/USD prints mild gains around the 1.0900 threshold as traders await fresh clues to extend the five-day uptrend during Wednesday’s sluggish Asian session.
Even so, the two-week-old rising trend channel joins the EUR/USD pair’s successful rebound from the 50-SMA, around 1.0835 by the press time, to underpin the bullish bias for the major currency pair.
It’s worth noting that the weekly resistance breakout and the firmer RSI (14) also keep the EUR/USD bulls hopeful.
That said, the EUR/USD bulls are en route to the top line of the aforementioned bullish channel, close to 1.0945 at the latest.
Following that, the 1.1000 round figure and March 2022 peak surrounding 1.1185 could gain the market’s attention.
Alternatively, pullback moves need to drop back below the immediate resistance-turned-support line from Monday, close to 1.0875 at the latest, before aiming for the 50-SMA support of 1.0838.
Even if the EUR/USD pair remains bearish past 1.0838, the lower line of the stated channel, near 1.0820 by the press time, becomes the key to watch for clear directions.
It should be observed that a horizontal area comprising multiple levels marked since the start of 2023, close to 1.0700, will be crucial for the EUR/USD bear’s conviction.
Trend: Further upside expected
Technical Levels: Supports and Resistances
EURUSD currently trading at 1.089 at the time of writing. Pair opened at 1.0882 and is trading with a change of 0.07% % .
| Overview | Overview.1 | |
|---|---|---|
| 0 | Today last price | 1.089 |
| 1 | Today Daily Change | 0.0008 |
| 2 | Today Daily Change % | 0.07% |
| 3 | Today daily open | 1.0882 |
The pair remains strongly bullish on the daily timeframe. It trades above its 20 SMA @ 1.0736, 50 SMA 1.0592, 100 SMA @ 1.0251 and 200 SMA @ 1.0311.
| Trends | Trends.1 | |
|---|---|---|
| 0 | Daily SMA20 | 1.0736 |
| 1 | Daily SMA50 | 1.0592 |
| 2 | Daily SMA100 | 1.0251 |
| 3 | Daily SMA200 | 1.0311 |
The previous day high was 1.0898 while the previous day low was 1.0835. The daily 38.2% Fib levels comes at 1.0874, expected to provide support. Similarly, the daily 61.8% fib level is at 1.0859, expected to provide support.
Note the levels of interest below:
- Pivot support is noted at 1.0845, 1.0809, 1.0783
- Pivot resistance is noted at 1.0908, 1.0934, 1.0971
| Levels | Levels.1 |
|---|---|
| Previous Daily High | 1.0898 |
| Previous Daily Low | 1.0835 |
| Previous Weekly High | 1.0888 |
| Previous Weekly Low | 1.0766 |
| Previous Monthly High | 1.0736 |
| Previous Monthly Low | 1.0393 |
| Daily Fibonacci 38.2% | 1.0874 |
| Daily Fibonacci 61.8% | 1.0859 |
| Daily Pivot Point S1 | 1.0845 |
| Daily Pivot Point S2 | 1.0809 |
| Daily Pivot Point S3 | 1.0783 |
| Daily Pivot Point R1 | 1.0908 |
| Daily Pivot Point R2 | 1.0934 |
| Daily Pivot Point R3 | 1.0971 |
[/s2If]
Join Our Telegram Group
")


