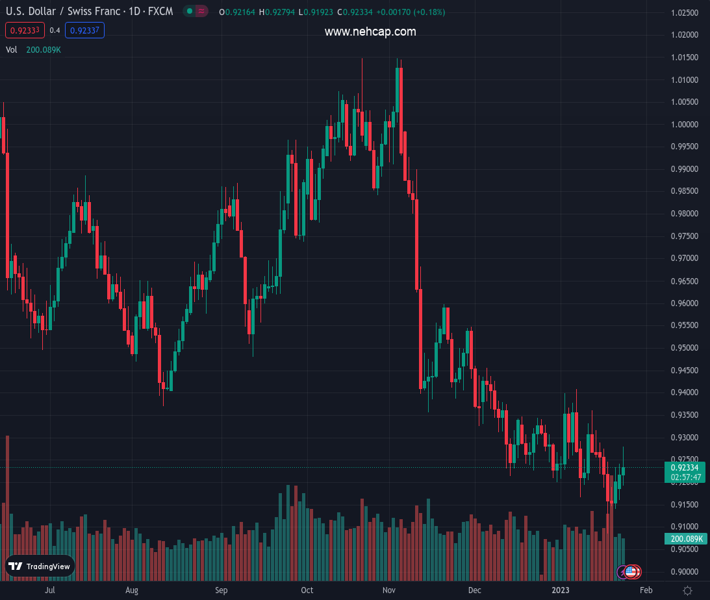
#USDCHF @ 0.92322 rises but clashes with the 20-day EMA and retreats some of its gains. (Pivot Orderbook analysis)
…
This is a premium post.
[s2If !current_user_can(access_s2member_level4)]Please register for PREMIUM VERSION HERE to read full post below containing analysis. In case of any error or you think you are not able to read the full post below, please email us at support#nehcap.com [lwa][/s2If] [s2If current_user_can(access_s2member_level4)]
- USD/CHF rises but clashes with the 20-day EMA and retreats some of its gains.
- The USD/CHF failure to crack 0.9300 exacerbated a pullback towards 0.9220s.
The pair currently trades last at 0.92322.
The previous day high was 0.9241 while the previous day low was 0.916. The daily 38.2% Fib levels comes at 0.921, expected to provide support. Similarly, the daily 61.8% fib level is at 0.9191, expected to provide support.
The USD/CHF climbs slightly after hitting a daily low of 0.9192 and reclaims the 0.9200 figure in the mid-North American session. Nevertheless, the USD/CHF surrendered some of its earlier gains once it failed to stay above the 20-day Exponential Moving Average (EMA). At the time of writing, the USD/CHF is trading at 0.9228.
The daily chart shows that the USD/CHF remains neutral to downward biased. It was further cemented by the USD/CHF pair, which after reaching a daily high of 0.9297, it was unable to stay above the 20-day EMA at 0.9248. The USD/CHF retreated further but persisted in positive territory.
If the USD/CHF registers a daily close around Tuesday’s open, that will form a doji, which could exacerbate a resumption of the downtrend, posing a threat to the YTD low of 0.9091. Nevertheless, on its way south, the USD/CHF would find some hurdles, like the 0.9150 February 21 daily low, followed by the 0.9100 mark, and then the YTD low.
As an alternate scenario, the USD/CHF first resistance would be the 20-day EMA at 0.9248, followed by 0.9300. A breach of the latter will expose the 50-day EMA at 0.9356, followed by 0.9400.
Technical Levels: Supports and Resistances
USDCHF currently trading at 0.9226 at the time of writing. Pair opened at 0.9223 and is trading with a change of 0.03 % .
| Overview | Overview.1 | |
|---|---|---|
| 0 | Today last price | 0.9226 |
| 1 | Today Daily Change | 0.0003 |
| 2 | Today Daily Change % | 0.0300 |
| 3 | Today daily open | 0.9223 |
The pair remains strongly bearish on the daily time frame. It trades below the 20 SMA @ 0.9257, 50 SMA 0.9341, 100 SMA @ 0.959 and 200 SMA @ 0.9638.
| Trends | Trends.1 | |
|---|---|---|
| 0 | Daily SMA20 | 0.9257 |
| 1 | Daily SMA50 | 0.9341 |
| 2 | Daily SMA100 | 0.9590 |
| 3 | Daily SMA200 | 0.9638 |
The previous day high was 0.9241 while the previous day low was 0.916. The daily 38.2% Fib levels comes at 0.921, expected to provide support. Similarly, the daily 61.8% fib level is at 0.9191, expected to provide support.
Note the levels of interest below:
- Pivot support is noted at 0.9175, 0.9127, 0.9094
- Pivot resistance is noted at 0.9256, 0.9289, 0.9337
| Levels | Levels.1 |
|---|---|
| Previous Daily High | 0.9241 |
| Previous Daily Low | 0.9160 |
| Previous Weekly High | 0.9288 |
| Previous Weekly Low | 0.9085 |
| Previous Monthly High | 0.9471 |
| Previous Monthly Low | 0.9201 |
| Daily Fibonacci 38.2% | 0.9210 |
| Daily Fibonacci 61.8% | 0.9191 |
| Daily Pivot Point S1 | 0.9175 |
| Daily Pivot Point S2 | 0.9127 |
| Daily Pivot Point S3 | 0.9094 |
| Daily Pivot Point R1 | 0.9256 |
| Daily Pivot Point R2 | 0.9289 |
| Daily Pivot Point R3 | 0.9337 |
[/s2If]
Join Our Telegram Group
")


