#GBPUSD @ 1.23331 reached its daily low after the release of US S&P Global PMIs. (Pivot Orderbook analysis)
…
This is a premium post.
[s2If !current_user_can(access_s2member_level4)]Please register for PREMIUM VERSION HERE to read full post below containing analysis. In case of any error or you think you are not able to read the full post below, please email us at support#nehcap.com [lwa][/s2If] [s2If current_user_can(access_s2member_level4)]
- GBP/USD reached its daily low after the release of US S&P Global PMIs.
- Business activity in the UK reignited recession fears and weakened the GBP.
- The market expects the Bank of England to hike rates by 50 bps on February 2 – RTRS Poll.
The pair currently trades last at 1.23331.
The previous day high was 1.2448 while the previous day low was 1.2324. The daily 38.2% Fib levels comes at 1.2371, expected to provide resistance. Similarly, the daily 61.8% fib level is at 1.2401, expected to provide resistance.
GBP/USD surrenders 1.2400 and drops towards the 1.2310 regions amid a mixed mood trading session, as US equities fluctuate between gainers/losers. Nevertheless, the American Dollar (USD) is losing traction and edging lower, capping the GBP/USD’s fall. At the time of writing, the GBP/USD is trading at 1.2320 after hitting a high of 1.2413.
Wall Street portrays a mixed picture, but it’s a matter of time before it turns positive. S&P Global reported that December’s PMIs for the United States (US) improved, with the Services PMI coming at 46.6 vs. 44.7 expected, while Manufacturing rose by 46.8 vs. estimates of 46.2. The S&P Global Composite, which measures both indices, increased by 46.6, higher than the foreseen 45 figure. Although business activity continues to show deterioration in the US economy, the downward trend moderated some.
Across the pond, UK’s business activity disappointed investors, with business activity falling at its fastest rate in two years, according to an S&P Global/CIPS Survey. “Weaker-than-expected PMI numbers in January underscore the risk of the UK slipping into recession,” S&P Global’s Chief Business Economist, Chris Williamson, said.
In the meantime, a Reuters Poll showed that 29 of 42 economists estimate the Bank of England to raise the Bank’s rate by 50 bps to 4% on February 2, while 13 estimated a 25 bps hike. In addition, the economists expect a peak rate of 4.25%.
Also read: Reuters Poll: Bank of England to lift bank rate by 50 bps to 4.00% on February 2
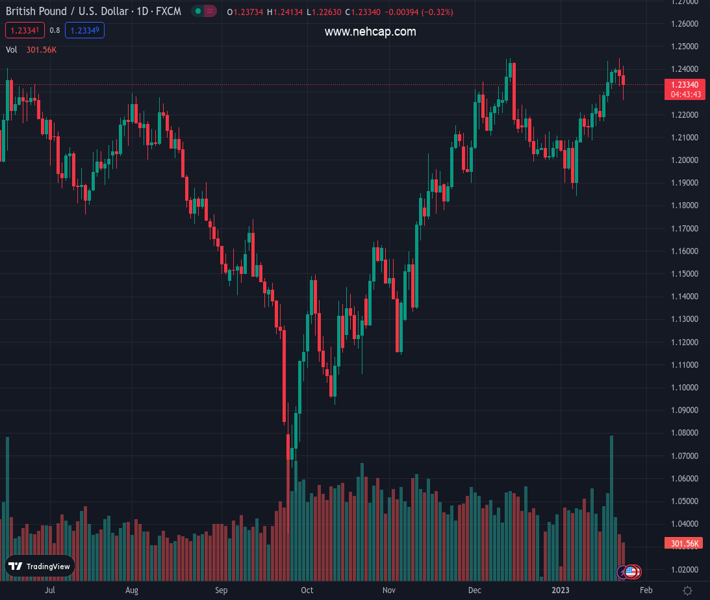
Technically, the GBP/USD daily chart suggests the pair is consolidating around 1.2400, unable to aim higher and test the 1.2500 mark. Also, in the last couple of days, successive lower lows have opened the door for further losses. Of note, the GBP/USD appears to be forming a double top. However, the GBP/USD would need to fall below the January 6 daily low of 1.1841 to confirm its validity.
GBP/USD Key support levels are the 1.2300 figure, the 20-day EMA at 1.2222 and 1.2100. On the flip side, the GBP/USD key resistance levels are 1.2400, followed by the YTD high of 1.2454 and the 1.2500 mark.
Technical Levels: Supports and Resistances
GBPUSD currently trading at 1.2322 at the time of writing. Pair opened at 1.2373 and is trading with a change of -0.41 % .
| Overview | Overview.1 | |
|---|---|---|
| 0 | Today last price | 1.2322 |
| 1 | Today Daily Change | -0.0051 |
| 2 | Today Daily Change % | -0.4100 |
| 3 | Today daily open | 1.2373 |
The pair remains strongly bullish on the daily timeframe. It trades above its 20 SMA @ 1.2159, 50 SMA 1.2123, 100 SMA @ 1.1732 and 200 SMA @ 1.1975.
| Trends | Trends.1 | |
|---|---|---|
| 0 | Daily SMA20 | 1.2159 |
| 1 | Daily SMA50 | 1.2123 |
| 2 | Daily SMA100 | 1.1732 |
| 3 | Daily SMA200 | 1.1975 |
The previous day high was 1.2448 while the previous day low was 1.2324. The daily 38.2% Fib levels comes at 1.2371, expected to provide resistance. Similarly, the daily 61.8% fib level is at 1.2401, expected to provide resistance.
Note the levels of interest below:
- Pivot support is noted at 1.2315, 1.2257, 1.2191
- Pivot resistance is noted at 1.244, 1.2506, 1.2564
| Levels | Levels.1 |
|---|---|
| Previous Daily High | 1.2448 |
| Previous Daily Low | 1.2324 |
| Previous Weekly High | 1.2436 |
| Previous Weekly Low | 1.2169 |
| Previous Monthly High | 1.2447 |
| Previous Monthly Low | 1.1992 |
| Daily Fibonacci 38.2% | 1.2371 |
| Daily Fibonacci 61.8% | 1.2401 |
| Daily Pivot Point S1 | 1.2315 |
| Daily Pivot Point S2 | 1.2257 |
| Daily Pivot Point S3 | 1.2191 |
| Daily Pivot Point R1 | 1.2440 |
| Daily Pivot Point R2 | 1.2506 |
| Daily Pivot Point R3 | 1.2564 |
[/s2If]
Join Our Telegram Group
")


