#USDJPY @ 129.916 back into negative territory after a spike following US data. (Pivot Orderbook analysis)
…
This is a premium post.
[s2If !current_user_can(access_s2member_level4)]Please register for PREMIUM VERSION HERE to read full post below containing analysis. In case of any error or you think you are not able to read the full post below, please email us at support#nehcap.com [lwa][/s2If] [s2If current_user_can(access_s2member_level4)]
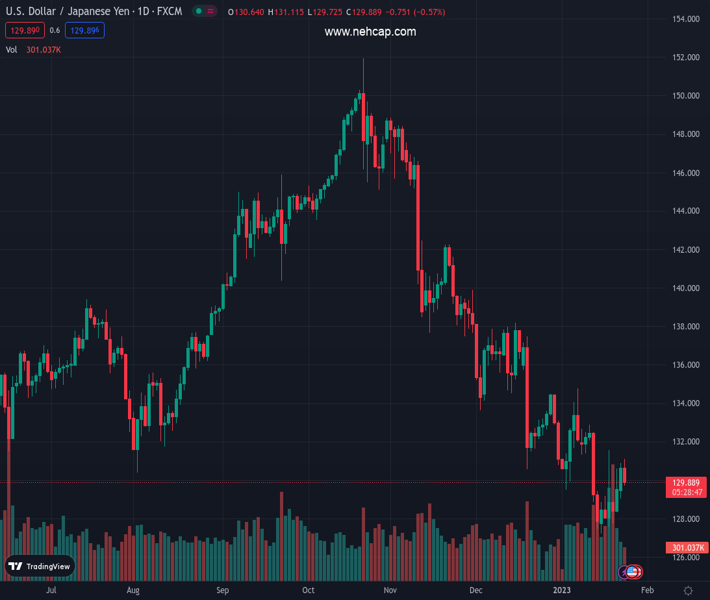
- USD/JPY back into negative territory after a spike following US data.
- US PMI S&P Global recovers in January, still below 50.
- US Dollar weakens during the American session amid risk appetite.
The pair currently trades last at 129.916.
The previous day high was 130.89 while the previous day low was 129.04. The daily 38.2% Fib levels comes at 130.19, expected to provide resistance. Similarly, the daily 61.8% fib level is at 129.75, expected to provide support.
The USD/JPY spiked to 131.21, following the release of US economic data but then pulled back toward 130.00 as stocks turned positive on Wall Street. The improvement in risk sentiment weighed on the US dollar.
Data released on Tuesday showed the PMI S&P Global Manufacturing rose in January according to preliminary numbers from 46.2 to 46.8, above the 46.1 of market consensus. The Service index climbed from 44.7 to 46.6, surpassing expectations of 44.5. Immediately after the release, the US dollar peaked but only to retreat later.
In Wall Street, after a negative opening main indexes are flat. Risk appetite and a retreat in US yields pushed USD/JPY to the downside. The pair is testing levels under 130.00, looking at the daily low it hit on Asian hours at 129.72.
Again, the 20-day Simple Moving Average, currently at 130.90, capped the upside. The main trend is bearish although in the short term, the Dollar is correcting higher. It continues to be unable to hold above 131.00. If it manages to do so, a deeper recovery seems likely.
Technical Levels: Supports and Resistances
USDJPY currently trading at 130.35 at the time of writing. Pair opened at 130.69 and is trading with a change of -0.26 % .
| Overview | Overview.1 | |
|---|---|---|
| 0 | Today last price | 130.35 |
| 1 | Today Daily Change | -0.34 |
| 2 | Today Daily Change % | -0.26 |
| 3 | Today daily open | 130.69 |
The pair remains strongly bearish on the daily time frame. It trades below the 20 SMA @ 131.01, 50 SMA 134.62, 100 SMA @ 139.99 and 200 SMA @ 136.73.
| Trends | Trends.1 | |
|---|---|---|
| 0 | Daily SMA20 | 131.01 |
| 1 | Daily SMA50 | 134.62 |
| 2 | Daily SMA100 | 139.99 |
| 3 | Daily SMA200 | 136.73 |
The previous day high was 130.89 while the previous day low was 129.04. The daily 38.2% Fib levels comes at 130.19, expected to provide resistance. Similarly, the daily 61.8% fib level is at 129.75, expected to provide support.
Note the levels of interest below:
- Pivot support is noted at 129.53, 128.36, 127.68
- Pivot resistance is noted at 131.37, 132.06, 133.22
| Levels | Levels.1 |
|---|---|
| Previous Daily High | 130.89 |
| Previous Daily Low | 129.04 |
| Previous Weekly High | 131.58 |
| Previous Weekly Low | 127.22 |
| Previous Monthly High | 138.18 |
| Previous Monthly Low | 130.57 |
| Daily Fibonacci 38.2% | 130.19 |
| Daily Fibonacci 61.8% | 129.75 |
| Daily Pivot Point S1 | 129.53 |
| Daily Pivot Point S2 | 128.36 |
| Daily Pivot Point S3 | 127.68 |
| Daily Pivot Point R1 | 131.37 |
| Daily Pivot Point R2 | 132.06 |
| Daily Pivot Point R3 | 133.22 |
[/s2If]
Join Our Telegram Group
")


