#GBPJPY @ 159.119 The finished Thursday’s session with minuscule losses of 0.01%. (Pivot Orderbook analysis)
…
This is a premium post.
[s2If !current_user_can(access_s2member_level4)]Please register for PREMIUM VERSION HERE to read full post below containing analysis. In case of any error or you think you are not able to read the full post below, please email us at support#nehcap.com [lwa][/s2If] [s2If current_user_can(access_s2member_level4)]
- The GBP/JPY finished Thursday’s session with minuscule losses of 0.01%.
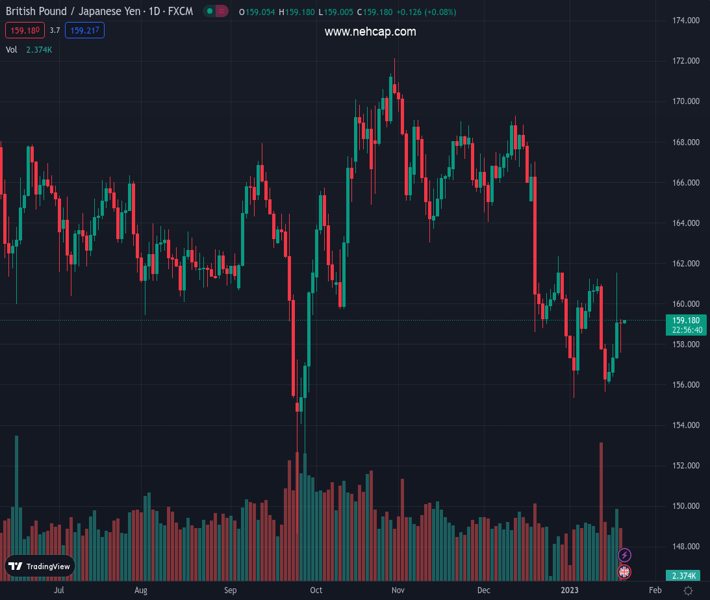
- GBP/JPY Price Analysis: Subdued, but once 159.00 is cleared, further downside is expected; otherwise, breaks above the 20-DMA, the uptrend will resume.
The pair currently trades last at 159.119.
The previous day high was 161.54 while the previous day low was 157.35. The daily 38.2% Fib levels comes at 159.94, expected to provide resistance. Similarly, the daily 61.8% fib level is at 158.95, expected to provide support.
The GBP/JPY recovered from earlier losses and finished Thursday’s session with minuscule gains after plummeting to daily lows of 157.56. However, the GBP/JPY stages a comeback and is set to finish the gains almost flat. As the Asian Pacific session begins, the GBP/JPY is trading at 159.04.
The daily chart shows that the GBP/JPY remains neutral-to-downward biased but trendless during the last seven days. Even though the GBP/JPY was hit by a jump in volatility, on the Bank of Japan’s decision, the exchange rate settled at around Thursday’s close.
Oscillators like the Relative Strength Index (RSI), although its slope is almost flat at bearish territory, while the Rate of Change (RoC) suggests that buying pressure is fading. Therefore, the GBP/JPY might continue to be range-bound unless it clears the first support/resistance levels.
The GBP/JPY, the first support level, would be the 159.00 psychological level. Once cleared, the next support would be the 158.00 figure, followed by the January 19 daily low of 157.56. As an alternate scenario, and the least likely, the GBP/JPY first resistance would be the 20-day Exponential Moving Average (EMA) at 159.54, followed by 160.00 and then the January 18 daily high of 161.52.
Technical Levels: Supports and Resistances
GBPJPY currently trading at 159.12 at the time of writing. Pair opened at 159.0 and is trading with a change of 0.08 % .
| Overview | Overview.1 | |
|---|---|---|
| 0 | Today last price | 159.12 |
| 1 | Today Daily Change | 0.12 |
| 2 | Today Daily Change % | 0.08 |
| 3 | Today daily open | 159.00 |
The pair remains strongly bearish on the daily time frame. It trades below the 20 SMA @ 159.18, 50 SMA 163.42, 100 SMA @ 164.06 and 200 SMA @ 163.56.
| Trends | Trends.1 | |
|---|---|---|
| 0 | Daily SMA20 | 159.18 |
| 1 | Daily SMA50 | 163.42 |
| 2 | Daily SMA100 | 164.06 |
| 3 | Daily SMA200 | 163.56 |
The previous day high was 161.54 while the previous day low was 157.35. The daily 38.2% Fib levels comes at 159.94, expected to provide resistance. Similarly, the daily 61.8% fib level is at 158.95, expected to provide support.
Note the levels of interest below:
- Pivot support is noted at 157.06, 155.12, 152.88
- Pivot resistance is noted at 161.24, 163.48, 165.42
| Levels | Levels.1 |
|---|---|
| Previous Daily High | 161.54 |
| Previous Daily Low | 157.35 |
| Previous Weekly High | 161.24 |
| Previous Weekly Low | 155.65 |
| Previous Monthly High | 169.28 |
| Previous Monthly Low | 157.84 |
| Daily Fibonacci 38.2% | 159.94 |
| Daily Fibonacci 61.8% | 158.95 |
| Daily Pivot Point S1 | 157.06 |
| Daily Pivot Point S2 | 155.12 |
| Daily Pivot Point S3 | 152.88 |
| Daily Pivot Point R1 | 161.24 |
| Daily Pivot Point R2 | 163.48 |
| Daily Pivot Point R3 | 165.42 |
[/s2If]
Join Our Telegram Group
")


