#GBPUSD @ 1.23867 struggles to refresh five-week high as the key resistance line probe bulls., @nehcap view: Further upside expected (Pivot Orderbook analysis)
…
This is a premium post.
[s2If !current_user_can(access_s2member_level4)]Please register for PREMIUM VERSION HERE to read full post below containing analysis. In case of any error or you think you are not able to read the full post below, please email us at support#nehcap.com [lwa][/s2If] [s2If current_user_can(access_s2member_level4)]
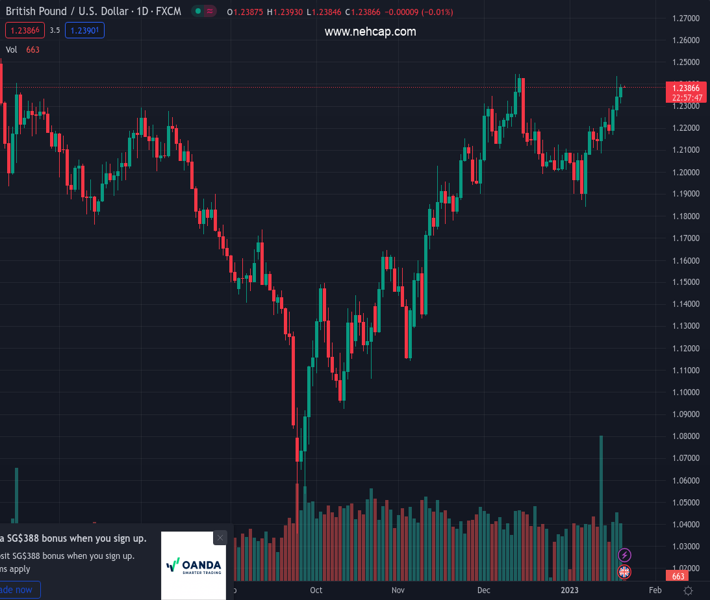
- GBP/USD struggles to refresh five-week high as the key resistance line probe bulls.
- Descending trend line from late May 2022 restricts immediate upside.
- Convergence of 200-DMA, 2.5-month-long ascending support line appears tough nut to crack for bears.
- RSI conditions suggest limited room towards the north.
The pair currently trades last at 1.23867.
The previous day high was 1.2436 while the previous day low was 1.2255. The daily 38.2% Fib levels comes at 1.2367, expected to provide support. Similarly, the daily 61.8% fib level is at 1.2324, expected to provide support.
GBP/USD bulls take a breather around the multi-day high near 1.2400, retreating to 1.2390 by the press time, as a downward-slopping resistance line from May 2022 restricts the immediate upside of the Cable pair.
Adding strength to the bullish bias could be the quote’s successful trading beyond the 200-DMA, as well as the successful rebound from 1.1841.
However, the RSI conditions hint at the limited upside room, which in turn highlights the aforementioned resistance line near 1.2400 as the short-term key hurdle.
Even if the GBP/USD buyers manage to cross the 1.2400 resistance, an ascending resistance line from August 2022, close to 1.2490 at the latest, could act as an additional upside filter.
It’s worth noting that the Cable pair’s run-up beyond 1.2490 could help the buyers approach the May 2022 peak surrounding 1.2665.
Alternatively, pullback moves may initially aim for the August 2022 peak surrounding 1.2290 before witnessing multiple supports near 1.2120 and 1.2100.
Though, a convergence of the 200-DMA and an ascending trend line from the last November, near 1.1980, appears the key support to watch for the GBP/USD bears.
Should the quote breaks the 1.1980 support confluence, the odds of witnessing a fresh monthly low, currently around 1.1840, can’t be ruled out.
Trend: Further upside expected
Technical Levels: Supports and Resistances
GBPUSD currently trading at 1.2388 at the time of writing. Pair opened at 1.2338 and is trading with a change of 0.41% % .
| Overview | Overview.1 | |
|---|---|---|
| 0 | Today last price | 1.2388 |
| 1 | Today Daily Change | 0.0050 |
| 2 | Today Daily Change % | 0.41% |
| 3 | Today daily open | 1.2338 |
The pair remains strongly bullish on the daily timeframe. It trades above its 20 SMA @ 1.2108, 50 SMA 1.2086, 100 SMA @ 1.1707 and 200 SMA @ 1.1985.
| Trends | Trends.1 | |
|---|---|---|
| 0 | Daily SMA20 | 1.2108 |
| 1 | Daily SMA50 | 1.2086 |
| 2 | Daily SMA100 | 1.1707 |
| 3 | Daily SMA200 | 1.1985 |
The previous day high was 1.2436 while the previous day low was 1.2255. The daily 38.2% Fib levels comes at 1.2367, expected to provide support. Similarly, the daily 61.8% fib level is at 1.2324, expected to provide support.
Note the levels of interest below:
- Pivot support is noted at 1.225, 1.2162, 1.2068
- Pivot resistance is noted at 1.2431, 1.2524, 1.2613
| Levels | Levels.1 |
|---|---|
| Previous Daily High | 1.2436 |
| Previous Daily Low | 1.2255 |
| Previous Weekly High | 1.2249 |
| Previous Weekly Low | 1.2086 |
| Previous Monthly High | 1.2447 |
| Previous Monthly Low | 1.1992 |
| Daily Fibonacci 38.2% | 1.2367 |
| Daily Fibonacci 61.8% | 1.2324 |
| Daily Pivot Point S1 | 1.2250 |
| Daily Pivot Point S2 | 1.2162 |
| Daily Pivot Point S3 | 1.2068 |
| Daily Pivot Point R1 | 1.2431 |
| Daily Pivot Point R2 | 1.2524 |
| Daily Pivot Point R3 | 1.2613 |
[/s2If]
Join Our Telegram Group
")


