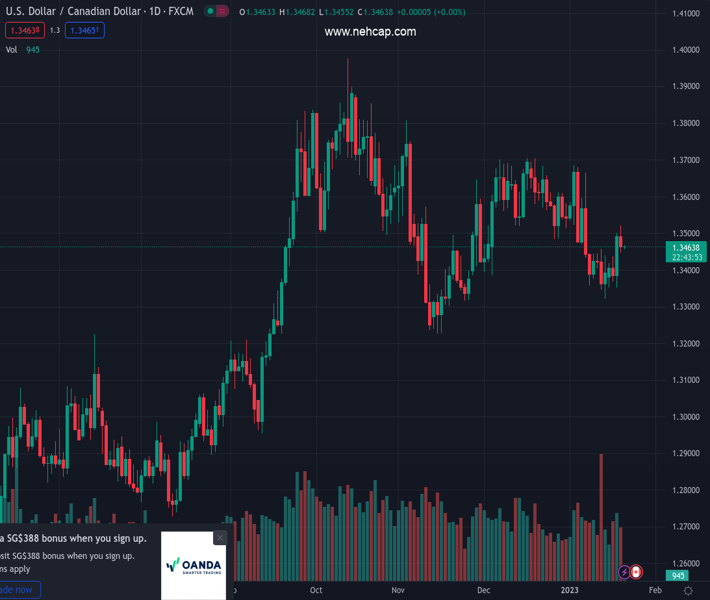
#USDCAD @ 1.34600 licks its wounds after reversing from two-week high. (Pivot Orderbook analysis)
…
This is a premium post.
[s2If !current_user_can(access_s2member_level4)]Please register for PREMIUM VERSION HERE to read full post below containing analysis. In case of any error or you think you are not able to read the full post below, please email us at support#nehcap.com [lwa][/s2If] [s2If current_user_can(access_s2member_level4)]
- USD/CAD licks its wounds after reversing from two-week high.
- Oil price remains firmer amid softer US Dollar, hopes of China demand.
- Recession woes, hawkish Fedspeak challenge Loonie bears ahead of the key Canadian statistics.
The pair currently trades last at 1.34600.
The previous day high was 1.35 while the previous day low was 1.3351. The daily 38.2% Fib levels comes at 1.3443, expected to provide support. Similarly, the daily 61.8% fib level is at 1.3408, expected to provide support.
USD/CAD pares the recent losses around 1.3465 as it picks up bids to reverse the previous day’s pullback from a fortnight high during Friday’s Asian session. In doing so, the Loonie pair ignores the firmer prices of Canada’s key export item, namely the WTI crude oil. The reason could be linked to the fresh fears surrounding the US economic growth and the hawkish Fedspeak.
WTI crude oil braces for the second weekly gains as it dribbles near $81.00 despite the US Energy Information Administration (EIA) reporting an increase in weekly Crude Oil Stocks Change with 8.408M versus -1.75M expected and 18.962M. The reason could be linked to the hopes of more energy demand from China, as well as the softer US Dollar. “Chinese oil demand climbed by nearly 1 million barrels per day (bpd) from the previous month to 15.41 million bpd in November, the highest level since February, according to the latest export figures published by the Joint Organisations Data Initiative,” reported Reuters.
On the other hand, the US Dollar Index (DXY) dropped the most in a week to snap a three-day uptrend as mixed data raised fears of a recession in the world’s biggest economy. In doing so, the greenback’s gauge versus the six major currencies failed to cheer the hawkish comments from the Federal Reserve (Fed) officials ahead of the pre-FOMC blackout starting this Saturday.
US Unemployment Claims dropped to the lowest levels since late April 2022, to 190K for the week ended on January 13 versus 214K expected and 205K prior. Further, the Philadelphia Fed Manufacturing Survey Index improved to -8.9 for January compared to -11.0 market forecasts and -13.7 previous readings. Alternatively, US Building Permits eased in December to 1.33M MoM versus 1.37M consensus and 1.351M prior while the Housing Starts also dropped to 1.382M during the stated month from 1.401M in November, versus 1.359M expected. It’s worth noting that the downbeat US Retail Sales and Producer Price Index (PPI) raised fears of an economic slowdown in the world’s largest economy after the softer wage growth and activity data flashed earlier.
That said, Federal Reserve Vice Chair Lael Brainard said that it will take time and resolve to get high inflation down to the fed’s 2% target. The policymaker also added, “The policy will need to be sufficiently restrictive for some time.” On the same line, Boston Fed President Collins signaled that the baseline remains that the effective fed funds rate should settle slightly above 5.0%, implying three more 25bp rate rises.
At home, Canadian Wholesale Sales growth eased to -0.5% MoM in November versus the 1.9% expected and prior.
Against this backdrop, Wall Street closed negative while the yields bounced off a multi-day low.
Looking forward, Canadian Retail Sales for November, expected -0.5% versus 1.4% prior, could help the USD/CAD pair to remain firmer on matching market forecasts. However, more attention will be given to the Fed speak and risk catalysts for clear directions.
A looming bull cross on the MACD and steady RSI backs the USD/CAD pair’s attempt to cross the 100-DMA hurdle, currently around 1.3515, despite failing to cross the same the previous day.
Technical Levels: Supports and Resistances
USDCAD currently trading at 1.3466 at the time of writing. Pair opened at 1.35 and is trading with a change of -0.25 % .
| Overview | Overview.1 | |
|---|---|---|
| 0 | Today last price | 1.3466 |
| 1 | Today Daily Change | -0.0034 |
| 2 | Today Daily Change % | -0.2500 |
| 3 | Today daily open | 1.3500 |
The pair is trading below its 20 Daily moving average @ 1.3505, below its 50 Daily moving average @ 1.3495 , below its 100 Daily moving average @ 1.3507 and above its 200 Daily moving average @ 1.3182
| Trends | Trends.1 | |
|---|---|---|
| 0 | Daily SMA20 | 1.3505 |
| 1 | Daily SMA50 | 1.3495 |
| 2 | Daily SMA100 | 1.3507 |
| 3 | Daily SMA200 | 1.3182 |
The previous day high was 1.35 while the previous day low was 1.3351. The daily 38.2% Fib levels comes at 1.3443, expected to provide support. Similarly, the daily 61.8% fib level is at 1.3408, expected to provide support.
Note the levels of interest below:
- Pivot support is noted at 1.3401, 1.3301, 1.3251
- Pivot resistance is noted at 1.355, 1.36, 1.3699
| Levels | Levels.1 |
|---|---|
| Previous Daily High | 1.3500 |
| Previous Daily Low | 1.3351 |
| Previous Weekly High | 1.3461 |
| Previous Weekly Low | 1.3322 |
| Previous Monthly High | 1.3705 |
| Previous Monthly Low | 1.3385 |
| Daily Fibonacci 38.2% | 1.3443 |
| Daily Fibonacci 61.8% | 1.3408 |
| Daily Pivot Point S1 | 1.3401 |
| Daily Pivot Point S2 | 1.3301 |
| Daily Pivot Point S3 | 1.3251 |
| Daily Pivot Point R1 | 1.3550 |
| Daily Pivot Point R2 | 1.3600 |
| Daily Pivot Point R3 | 1.3699 |
[/s2If]
Join Our Telegram Group
")


