#NZDUSD @ 0.63920 is displaying a lackluster performance as investors await PBoC’s policy announcement for fresh cues. (Pivot Orderbook analysis)
…
This is a premium post.
[s2If !current_user_can(access_s2member_level4)]Please register for PREMIUM VERSION HERE to read full post below containing analysis. In case of any error or you think you are not able to read the full post below, please email us at support#nehcap.com [lwa][/s2If] [s2If current_user_can(access_s2member_level4)]
- NZD/USD is displaying a lackluster performance as investors await PBoC’s policy announcement for fresh cues.
- A surprise resignation from Prime Minister Jacinda Ardern has triggered political instability in New Zealand.
- The US Dollar Index is expected to display power-pack action after commentaries from Fed policymakers.
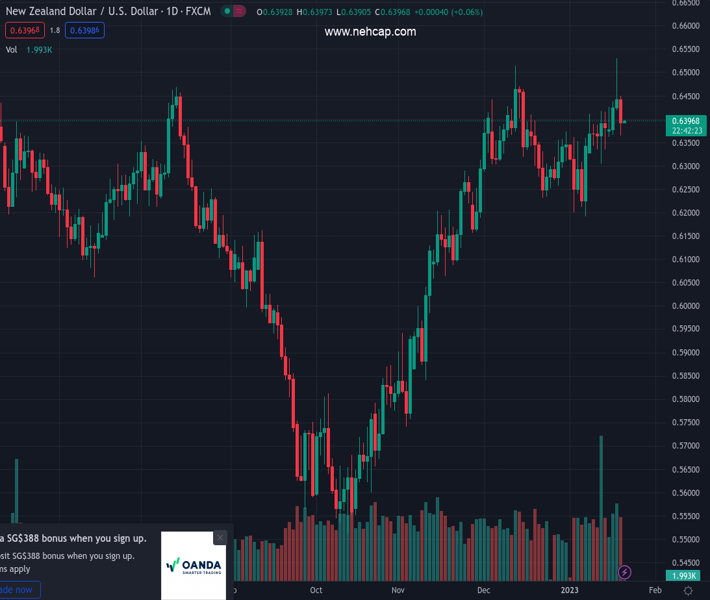
The pair currently trades last at 0.63920.
The previous day high was 0.6531 while the previous day low was 0.637. The daily 38.2% Fib levels comes at 0.6469, expected to provide resistance. Similarly, the daily 61.8% fib level is at 0.6431, expected to provide resistance.
The NZD/USD pair is oscillating in a narrow range around the critical resistance of 0.6400 in the early Tokyo session. The Kiwi asset has turned sideways as investors are awaiting the announcement of the interest rate decision by the People’s Bank of China (PBoC), which is scheduled for Friday.
Considering the recent reopening measures by the Chinese administration to get back on the progress track after remaining locked in the fight against the Covid-19 epidemic, the PBoC might announce an easy monetary policy. It is highly required to inject severe liquidity into the economy to spur the growth rate, provide support to the vulnerable real estate sector, and to boost infrastructure. Therefore, the central bank could trim the Prime Lending Rate (PLR) ahead.
It is worth noting that New Zealand is one of the leading trading partners of China and a loose monetary policy announcement by the PBoC will also provide support to the New Zealand Dollar.
Meanwhile, political instability in the New Zealand economy has grown after a surprise resignation from Prime Minister Jacinda Ardern. This might keep the New Zealand Dollar volatile for a period of time ahead.
The risk profile is highly negative considering the three-day selling spell in risk-perceived assets like S&P500. United States equities witnessed severe selling pressure amid escalating recession worries as Industrial Production has fallen in six out of eight last months. Rising interest rates by the Federal Reserve (Fed) are squeezing the activities in the economy and sooner may dampen the labor market.
The US Dollar Index (DXY) has dropped to near 101.60 after failing to extend recovery above the critical resistance of 102.00. For further guidance, investors will focus on commentaries from Federal Reserve (Fed) policymakers.
Technical Levels: Supports and Resistances
NZDUSD currently trading at 0.6393 at the time of writing. Pair opened at 0.6429 and is trading with a change of -0.56 % .
| Overview | Overview.1 | |
|---|---|---|
| 0 | Today last price | 0.6393 |
| 1 | Today Daily Change | -0.0036 |
| 2 | Today Daily Change % | -0.5600 |
| 3 | Today daily open | 0.6429 |
The pair remains strongly bullish on the daily timeframe. It trades above its 20 SMA @ 0.6334, 50 SMA 0.6296, 100 SMA @ 0.6057 and 200 SMA @ 0.6204.
| Trends | Trends.1 | |
|---|---|---|
| 0 | Daily SMA20 | 0.6334 |
| 1 | Daily SMA50 | 0.6296 |
| 2 | Daily SMA100 | 0.6057 |
| 3 | Daily SMA200 | 0.6204 |
The previous day high was 0.6531 while the previous day low was 0.637. The daily 38.2% Fib levels comes at 0.6469, expected to provide resistance. Similarly, the daily 61.8% fib level is at 0.6431, expected to provide resistance.
Note the levels of interest below:
- Pivot support is noted at 0.6356, 0.6282, 0.6194
- Pivot resistance is noted at 0.6517, 0.6604, 0.6678
| Levels | Levels.1 |
|---|---|
| Previous Daily High | 0.6531 |
| Previous Daily Low | 0.6370 |
| Previous Weekly High | 0.6418 |
| Previous Weekly Low | 0.6314 |
| Previous Monthly High | 0.6514 |
| Previous Monthly Low | 0.6230 |
| Daily Fibonacci 38.2% | 0.6469 |
| Daily Fibonacci 61.8% | 0.6431 |
| Daily Pivot Point S1 | 0.6356 |
| Daily Pivot Point S2 | 0.6282 |
| Daily Pivot Point S3 | 0.6194 |
| Daily Pivot Point R1 | 0.6517 |
| Daily Pivot Point R2 | 0.6604 |
| Daily Pivot Point R3 | 0.6678 |
[/s2If]
Join Our Telegram Group
")


