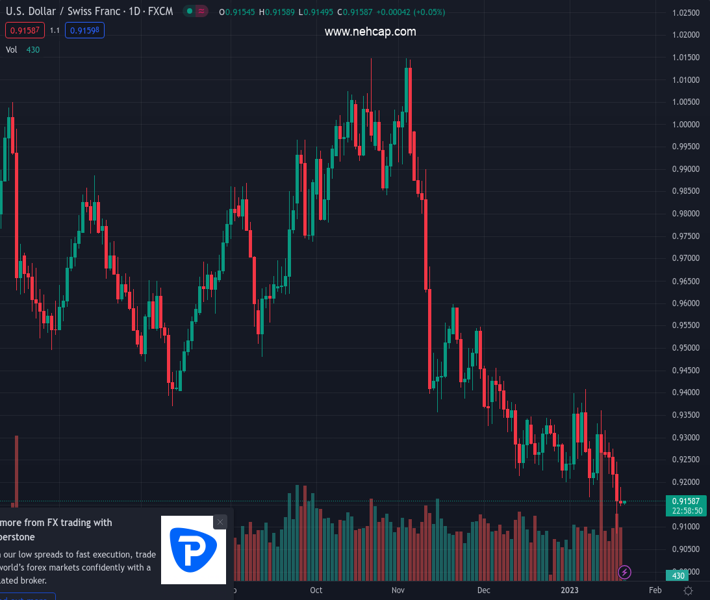
#USDCHF @ 0.91620 is displaying a sideways auction amid the absence of a potential trigger. (Pivot Orderbook analysis)
…
This is a premium post.
[s2If !current_user_can(access_s2member_level4)]Please register for PREMIUM VERSION HERE to read full post below containing analysis. In case of any error or you think you are not able to read the full post below, please email us at support#nehcap.com [lwa][/s2If] [s2If current_user_can(access_s2member_level4)]
- USD/CHF is displaying a sideways auction amid the absence of a potential trigger.
- The downward-sloping trendline plotted from 0.9137 will act as a major barricade for the US Dollar.
- The US Treasury yields have rebounded after printing a multi-month low.
The pair currently trades last at 0.91620.
The previous day high was 0.9246 while the previous day low was 0.9085. The daily 38.2% Fib levels comes at 0.9147, expected to provide support. Similarly, the daily 61.8% fib level is at 0.9185, expected to provide resistance.
The USD/CHF pair is displaying topsy-turvy moves above the immediate support of 0.9150 in the early Tokyo session. The Swiss franc asset oscillated in a mere 40-pips range on Thursday amid an absence of a potential trigger that could trigger a power-pack action. Also, the US Dollar Index (DXY) is displaying signs of volatility contraction.
The USD Index has slipped to near 101.60, demonstrating a subdued performance. Meanwhile, the US Treasury yields have rebounded after printing a multi-months low. The 10-year US Treasury Yields have recovered to above 3.39%.
On an hourly scale, USD/CHF is displaying a rangebound structure, which indicates volatility contraction that will be exploded after a critical trigger. The asset witnessed a responsive buying action after dropping to near 0.9085 on Wednesday. The absence of a follow-up buying is indicating that the recovery move could be faded sooner. Apart from that, the downward-sloping trendline from January 13 high at 0.9137 will act as a major barricade for the US Dollar.
The 20-period Exponential Moving Average (EMA) at 0.9162 has overlapped the asset, demonstrating a sideways auction profile.
Also, the Relative Strength Index (RSI) (14) is oscillating in a 40.00-60.00 range, showing a rangebound structure.
For an upside move, USD/CHF needs to break above January 11 low of around 0.9200, which will drive the asset towards January 18 high at 0.9246 followed by January 16 high at 0.9289.
On the contrary, a breakdown of Wednesday’s low at 0.9085 will drag the major towards 4 June 2021 high at 0.9054. A slippage below the latter will drag the asset further towards 4 August 2021 low at 0.9018.
Technical Levels: Supports and Resistances
USDCHF currently trading at 0.9159 at the time of writing. Pair opened at 0.9168 and is trading with a change of -0.1 % .
| Overview | Overview.1 | |
|---|---|---|
| 0 | Today last price | 0.9159 |
| 1 | Today Daily Change | -0.0009 |
| 2 | Today Daily Change % | -0.1000 |
| 3 | Today daily open | 0.9168 |
The pair remains strongly bearish on the daily time frame. It trades below the 20 SMA @ 0.9277, 50 SMA 0.9359, 100 SMA @ 0.9609 and 200 SMA @ 0.9642.
| Trends | Trends.1 | |
|---|---|---|
| 0 | Daily SMA20 | 0.9277 |
| 1 | Daily SMA50 | 0.9359 |
| 2 | Daily SMA100 | 0.9609 |
| 3 | Daily SMA200 | 0.9642 |
The previous day high was 0.9246 while the previous day low was 0.9085. The daily 38.2% Fib levels comes at 0.9147, expected to provide support. Similarly, the daily 61.8% fib level is at 0.9185, expected to provide resistance.
Note the levels of interest below:
- Pivot support is noted at 0.9087, 0.9006, 0.8926
- Pivot resistance is noted at 0.9248, 0.9327, 0.9408
| Levels | Levels.1 |
|---|---|
| Previous Daily High | 0.9246 |
| Previous Daily Low | 0.9085 |
| Previous Weekly High | 0.9363 |
| Previous Weekly Low | 0.9167 |
| Previous Monthly High | 0.9471 |
| Previous Monthly Low | 0.9201 |
| Daily Fibonacci 38.2% | 0.9147 |
| Daily Fibonacci 61.8% | 0.9185 |
| Daily Pivot Point S1 | 0.9087 |
| Daily Pivot Point S2 | 0.9006 |
| Daily Pivot Point S3 | 0.8926 |
| Daily Pivot Point R1 | 0.9248 |
| Daily Pivot Point R2 | 0.9327 |
| Daily Pivot Point R3 | 0.9408 |
[/s2If]
Join Our Telegram Group
")


