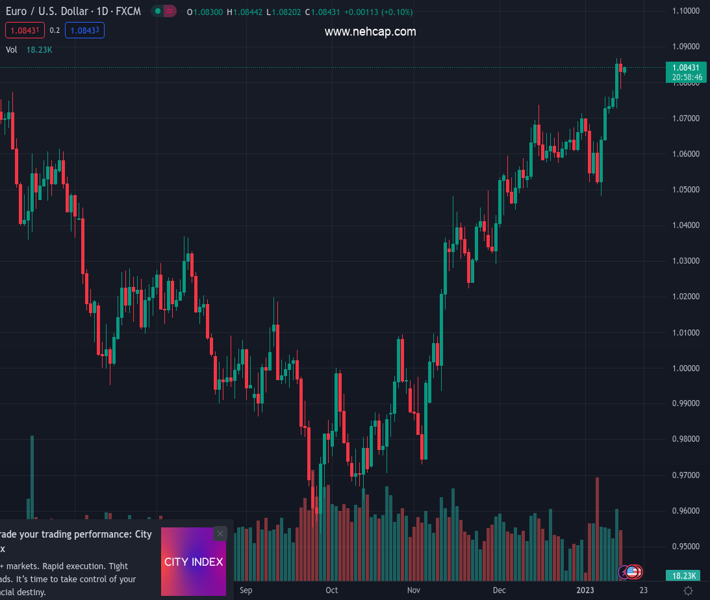
#EURUSD @ 1.08426 is oscillating below 1.0850 amid a holiday in the United States market. (Pivot Orderbook analysis)
…
This is a premium post.
[s2If !current_user_can(access_s2member_level4)]Please register for PREMIUM VERSION HERE to read full post below containing analysis. In case of any error or you think you are not able to read the full post below, please email us at support#nehcap.com [lwa][/s2If] [s2If current_user_can(access_s2member_level4)]
- EUR/USD is oscillating below 1.0850 amid a holiday in the United States market.
- The US Dollar Index (DXY) is looking to drop below the immediate support of 101.75 amid an upbeat market mood.
- The release of the US PPI and Retail Sales will provide decisive moves in the asset ahead.
The pair currently trades last at 1.08426.
The previous day high was 1.0868 while the previous day low was 1.078. The daily 38.2% Fib levels comes at 1.0814, expected to provide support. Similarly, the daily 61.8% fib level is at 1.0835, expected to provide support.
The EUR/USD pair is struggling to find any direction as the United States markets are closed on Monday on account of Martin Luther King’s Birthday. The major currency pair is juggling below 1.0840 as investors have shifted their focus toward the release of the United States Producer Price Index (PPI) and Retail Sales data.
S&P500 futures witnessed marginal selling pressure in early Asia but have recovered their losses and have also turned positive, portraying an improvement in investors’ risk appetite. The US Dollar Index (DXY) is looking to drop below the immediate support of 101.75 amid an upbeat market mood.
Last week, the USD Index witnessed immense pressure after a slowdown in December’s Consumer Price Index (CPI) in the United States, which bolstered the case of a smaller interest rate hike announcement by the Federal Reserve (Fed) ahead. Going forward, the USD Index could continue its downside trend for a longer period as the Fed will look to pause policy tightening.
In the view of economists at Wells Fargo, an end to monetary tightening should bring the US Dollar’s gains to an end by early 2023. Indeed, we believe a peak in the trade-weighted US Dollar for the current cycle has already been reached.” They forecasted a somewhat more pronounced pace of USD depreciation in 2024, once the Fed begins cutting its policy interest rate by early next year.
On Wednesday, investors will focus on the release of the US Producer Price Index (PPI) data. The street is expecting a decline amid lower gasoline prices, which has provided room to producers to trim prices at factory gates due to lower production costs. Also, a decline in retail demand will be equalized by lower prices. Apart from that, Retail Sales data will be keenly focused.
Meanwhile, Eurozone investors are cheering Germany’s preliminary Gross Domestic Product (GDP) expanded by 1.9% on an annualized basis in 2022 when compared to the +1.8% market consensus and +2.6% the prior release.
Technical Levels: Supports and Resistances
EURUSD currently trading at 1.0832 at the time of writing. Pair opened at 1.0832 and is trading with a change of 0.0 % .
| Overview | Overview.1 | |
|---|---|---|
| 0 | Today last price | 1.0832 |
| 1 | Today Daily Change | 0.0000 |
| 2 | Today Daily Change % | 0.0000 |
| 3 | Today daily open | 1.0832 |
The pair remains strongly bullish on the daily timeframe. It trades above its 20 SMA @ 1.0659, 50 SMA 1.0502, 100 SMA @ 1.019 and 200 SMA @ 1.0311.
| Trends | Trends.1 | |
|---|---|---|
| 0 | Daily SMA20 | 1.0659 |
| 1 | Daily SMA50 | 1.0502 |
| 2 | Daily SMA100 | 1.0190 |
| 3 | Daily SMA200 | 1.0311 |
The previous day high was 1.0868 while the previous day low was 1.078. The daily 38.2% Fib levels comes at 1.0814, expected to provide support. Similarly, the daily 61.8% fib level is at 1.0835, expected to provide support.
Note the levels of interest below:
- Pivot support is noted at 1.0786, 1.0739, 1.0698
- Pivot resistance is noted at 1.0874, 1.0915, 1.0961
| Levels | Levels.1 |
|---|---|
| Previous Daily High | 1.0868 |
| Previous Daily Low | 1.0780 |
| Previous Weekly High | 1.0868 |
| Previous Weekly Low | 1.0639 |
| Previous Monthly High | 1.0736 |
| Previous Monthly Low | 1.0393 |
| Daily Fibonacci 38.2% | 1.0814 |
| Daily Fibonacci 61.8% | 1.0835 |
| Daily Pivot Point S1 | 1.0786 |
| Daily Pivot Point S2 | 1.0739 |
| Daily Pivot Point S3 | 1.0698 |
| Daily Pivot Point R1 | 1.0874 |
| Daily Pivot Point R2 | 1.0915 |
| Daily Pivot Point R3 | 1.0961 |
[/s2If]
Join Our Telegram Group
")


