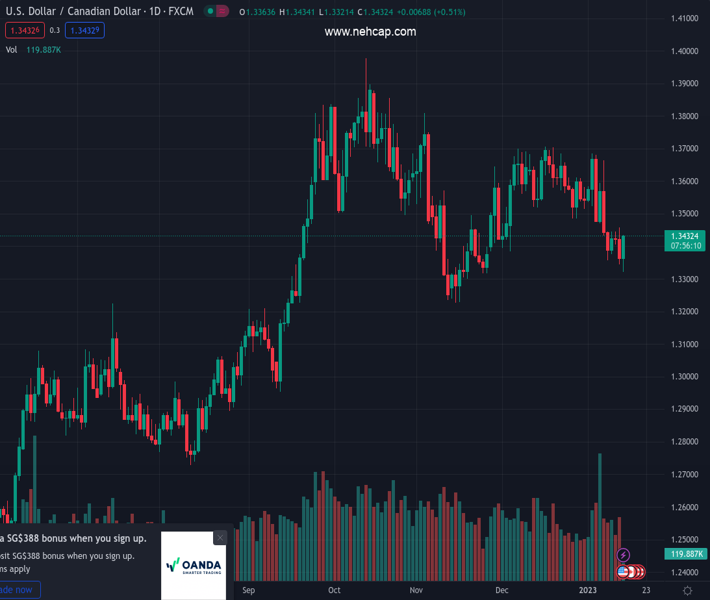
#USDCAD @ 1.34299 stages a solid intraday recovery amid a strong pickup in the USD demand. (Pivot Orderbook analysis)
…
This is a premium post.
[s2If !current_user_can(access_s2member_level4)]Please register for PREMIUM VERSION HERE to read full post below containing analysis. In case of any error or you think you are not able to read the full post below, please email us at support#nehcap.com [lwa][/s2If] [s2If current_user_can(access_s2member_level4)]
- USD/CAD stages a solid intraday recovery amid a strong pickup in the USD demand.
- Rebounding US bond yields and the risk-off impulse lifts the safe-haven greenback.
- Positive crude oil prices could underpin the Loonie and cap the upside for the major.
The pair currently trades last at 1.34299.
The previous day high was 1.3461 while the previous day low was 1.3345. The daily 38.2% Fib levels comes at 1.339, expected to provide support. Similarly, the daily 61.8% fib level is at 1.3417, expected to provide support.
The USD/CAD pair rebounds sharply from the 1.3320 area, or its lowest level since November 25 touched earlier this Friday and scales higher through the early North American session. The momentum lifts spot prices further beyond the 1.3400 mark and is sponsored by a goodish pickup in the US Dollar demand.
The USD Index, which measures the greenback’s performance against a basket of currencies, stages a solid recovery from a seven-month low and draws support from a combination of factors. Concerns about a deeper global economic downturn continue to cap any optimism in the markets. This is evident from a fresh wave of the global risk-aversion trade and benefits the safe-haven status buck. Apart from this, an intraday rally in the US Treasury bond yields offers additional support to the USD.
That said, growing acceptance that the Federal Reserve will soften its hawkish stance could act as a headwind for the US bond yields and the greenback. In fact, the markets are now pricing in a smaller 25 bps rate hike in February. The bets were lifted by Thursday’s release of the US consumer inflation figures and comments by several Fed officials. This, in turn, might hold back the USD bulls from placing aggressive bets and keep a lid on any meaningful upside for the USD/CAD pair.
Apart from this, positive crude oil prices could underpin the commodity-linked Loonie and contribute to capping the USD/CAD pair. Hence, it will be prudent to wait for strong follow-through buying before confirming that spot prices have formed a near-term bottom and positioning for further gains. Traders now look to the Preliminary Michigan Consumer Sentiment Index from the US for some impetus. This, along with oil price dynamics, could allow traders to grab short-term opportunities.
Technical Levels: Supports and Resistances
USDCAD currently trading at 1.3417 at the time of writing. Pair opened at 1.3362 and is trading with a change of 0.41 % .
| Overview | Overview.1 | |
|---|---|---|
| 0 | Today last price | 1.3417 |
| 1 | Today Daily Change | 0.0055 |
| 2 | Today Daily Change % | 0.4100 |
| 3 | Today daily open | 1.3362 |
The pair is trading below its 20 Daily moving average @ 1.3549, below its 50 Daily moving average @ 1.35 , below its 100 Daily moving average @ 1.3493 and above its 200 Daily moving average @ 1.3165
| Trends | Trends.1 | |
|---|---|---|
| 0 | Daily SMA20 | 1.3549 |
| 1 | Daily SMA50 | 1.3500 |
| 2 | Daily SMA100 | 1.3493 |
| 3 | Daily SMA200 | 1.3165 |
The previous day high was 1.3461 while the previous day low was 1.3345. The daily 38.2% Fib levels comes at 1.339, expected to provide support. Similarly, the daily 61.8% fib level is at 1.3417, expected to provide support.
Note the levels of interest below:
- Pivot support is noted at 1.3318, 1.3274, 1.3202
- Pivot resistance is noted at 1.3434, 1.3506, 1.355
| Levels | Levels.1 |
|---|---|
| Previous Daily High | 1.3461 |
| Previous Daily Low | 1.3345 |
| Previous Weekly High | 1.3685 |
| Previous Weekly Low | 1.3433 |
| Previous Monthly High | 1.3705 |
| Previous Monthly Low | 1.3385 |
| Daily Fibonacci 38.2% | 1.3390 |
| Daily Fibonacci 61.8% | 1.3417 |
| Daily Pivot Point S1 | 1.3318 |
| Daily Pivot Point S2 | 1.3274 |
| Daily Pivot Point S3 | 1.3202 |
| Daily Pivot Point R1 | 1.3434 |
| Daily Pivot Point R2 | 1.3506 |
| Daily Pivot Point R3 | 1.3550 |
[/s2If]
Join Our Telegram Group
")


