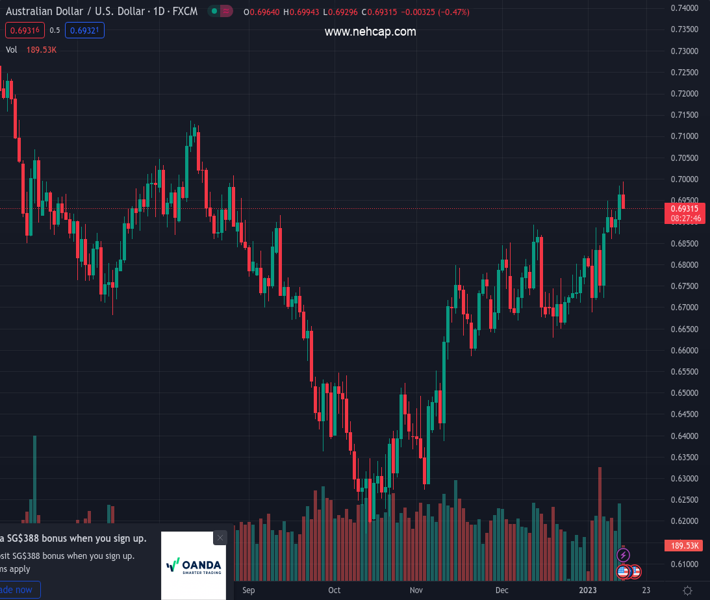
#AUDUSD @ 0.69345 fails ahead of the 0.7000 mark and corrects from a multi-month top touched on Friday. (Pivot Orderbook analysis)
…
This is a premium post.
[s2If !current_user_can(access_s2member_level4)]Please register for PREMIUM VERSION HERE to read full post below containing analysis. In case of any error or you think you are not able to read the full post below, please email us at support#nehcap.com [lwa][/s2If] [s2If current_user_can(access_s2member_level4)]
- AUD/USD fails ahead of the 0.7000 mark and corrects from a multi-month top touched on Friday.
- A combination of factors helps revive the USD demand and exerts downward pressure on the pair.
- The technical setup favours bulls and supports prospects for the emergence of some dip-buying.
The pair currently trades last at 0.69345.
The previous day high was 0.6985 while the previous day low was 0.6877. The daily 38.2% Fib levels comes at 0.6944, expected to provide resistance. Similarly, the daily 61.8% fib level is at 0.6918, expected to provide support.
The AUD/USD pair retreats from the vicinity of the 0.7000 psychological mark or the highest level since August 26 and continues losing ground through the early North American session. The pair drops to a fresh daily low, around the 0.6935 region in the last hour, eroding a part of the previous day’s post-US CPI gains and snapping a two-day winning streak.
A modest bounce in the US Treasury bond yields helps the US Dollar to stall its recent decline to a seven-month low. Apart from this, the risk-off impulse – as depicted by a sharp fall in the equity markets – further benefits the greenback’s relative safe-haven status and weighs on the risk-sensitive Aussie. That said, rising bets for smaller Fed rate hikes might keep a lid on any meaningful gains for the buck and limit deeper losses for the major, at least for the time being.
From a technical perspective, the AUD/USD pair has been scaling higher along an ascending channel over the past three months or so, which points to a well-established uptrend. Adding to this, the recent breakout through the very important 200-day SMA and the overnight strength beyond the 50% Fibonacci retracement level of the April-October 2022 downfall favours bullish traders. This, along with positive oscillators on the daily chart, supports prospects for the emergence of some dip-buying.
Hence, any subsequent slide is more likely to find decent support near the 0.6900 mark ahead of the 0.6870-0.6865 horizontal zone. This is followed by support near the 0.6830 region (200- DMA), which should now act as a pivotal point for the AUD/USD pair. A convincing break below could accelerate the fall towards the 0.6800 mark en route to the trend-channel support. The latter is pegged around the mid-0.6700s and nears the 38.2% Fibo. level, which should protect any further decline.
On the flip side, bulls might now wait for a sustained strength beyond the 0.7000 mark before placing fresh bets. The AUD/USD pair might then aim to surpass an intermediate hurdle near the 0.7030-0.7035 region and the 0.7070-0.7075 zone before eventually climbing to the 0.7100 round figure.
Technical Levels: Supports and Resistances
AUDUSD currently trading at 0.6938 at the time of writing. Pair opened at 0.6968 and is trading with a change of -0.43 % .
| Overview | Overview.1 | |
|---|---|---|
| 0 | Today last price | 0.6938 |
| 1 | Today Daily Change | -0.0030 |
| 2 | Today Daily Change % | -0.4300 |
| 3 | Today daily open | 0.6968 |
The pair remains strongly bullish on the daily timeframe. It trades above its 20 SMA @ 0.678, 50 SMA 0.6729, 100 SMA @ 0.6634 and 200 SMA @ 0.6834.
| Trends | Trends.1 | |
|---|---|---|
| 0 | Daily SMA20 | 0.6780 |
| 1 | Daily SMA50 | 0.6729 |
| 2 | Daily SMA100 | 0.6634 |
| 3 | Daily SMA200 | 0.6834 |
The previous day high was 0.6985 while the previous day low was 0.6877. The daily 38.2% Fib levels comes at 0.6944, expected to provide resistance. Similarly, the daily 61.8% fib level is at 0.6918, expected to provide support.
Note the levels of interest below:
- Pivot support is noted at 0.6902, 0.6836, 0.6794
- Pivot resistance is noted at 0.701, 0.7051, 0.7118
| Levels | Levels.1 |
|---|---|
| Previous Daily High | 0.6985 |
| Previous Daily Low | 0.6877 |
| Previous Weekly High | 0.6887 |
| Previous Weekly Low | 0.6688 |
| Previous Monthly High | 0.6893 |
| Previous Monthly Low | 0.6629 |
| Daily Fibonacci 38.2% | 0.6944 |
| Daily Fibonacci 61.8% | 0.6918 |
| Daily Pivot Point S1 | 0.6902 |
| Daily Pivot Point S2 | 0.6836 |
| Daily Pivot Point S3 | 0.6794 |
| Daily Pivot Point R1 | 0.7010 |
| Daily Pivot Point R2 | 0.7051 |
| Daily Pivot Point R3 | 0.7118 |
[/s2If]
Join Our Telegram Group
")


