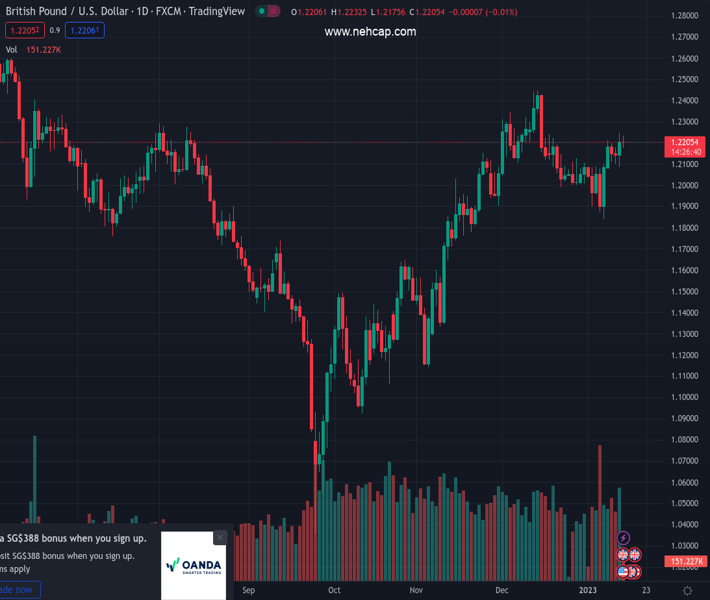
#GBPUSD @ 1.22014 is seen oscillating in a narrow trading band through the early European session on Friday. (Pivot Orderbook analysis)
…
This is a premium post.
[s2If !current_user_can(access_s2member_level4)]Please register for PREMIUM VERSION HERE to read full post below containing analysis. In case of any error or you think you are not able to read the full post below, please email us at support#nehcap.com [lwa][/s2If] [s2If current_user_can(access_s2member_level4)]
- GBP/USD is seen oscillating in a narrow trading band through the early European session on Friday.
- A modest USD recovery from a multi-month low acts as a headwind amid dovish BoE expectations.
- The mixed UK macro data fails to impress traders or provide any meaningful impetus to the major.
The pair currently trades last at 1.22014.
The previous day high was 1.2247 while the previous day low was 1.2088. The daily 38.2% Fib levels comes at 1.2186, expected to provide support. Similarly, the daily 61.8% fib level is at 1.2149, expected to provide support.
The GBP/USD pair struggles to capitalize on the previous day’s positive move to a nearly four-week top and witnessed subdued price action on Friday. Spot prices seesaw between tepid gains/minor losses, around the 1.2200 mark through the early European session and moves little following the release of the UK macro data.
The UK Office for National Statistics reported that the economy expanded a modest 0.1% in November as compared to estimates for a 0.2% contraction. This, however, marked a notable decline from the 0.5% growth recorded in October and was accompanied by the disappointing release of the UK industrial and manufacturing production data. This comes on the back of a bleak outlook for the UK economy, which has been fueling speculations that the Bank of England (BoE) is nearing the end of the current rate-hiking cycle and undermines the British Pound. Apart from this, a modest US Dollar recovery from a seven-month low further contributes to capping the GBP/USD pair.
A modest uptick in the US Treasury bond yields and a softer tone around the equity markets offer some support to the safe-haven greenback. That said, rising bets for smaller Fed rate hikes going forward continue to act as a headwind for the USD and lend some support to the GBP/USD pair, at least for the time being. Investors now seem convinced that the Fed will soften its hawkish stance and the bets were reinforced by the latest US consumer inflation figures released on Thursday. This, in turn, makes it prudent to wait for strong follow-through selling around the major before traders start positioning for any meaningful corrective downfall in the near term.
Market participants now look forward to the US economic docket, featuring the Preliminary Michigan Consumer Sentiment Index later during the early North American session. This, along with the US bond yields and the broader risk sentiment, will drive the USD demand and provide some impetus to the GBP/USD pair. Nevertheless, spot prices seem poised to end in the green for the third successive week and remain at the mercy of the USD price dynamics.
Technical Levels: Supports and Resistances
GBPUSD currently trading at 1.2197 at the time of writing. Pair opened at 1.2214 and is trading with a change of -0.14 % .
| Overview | Overview.1 | |
|---|---|---|
| 0 | Today last price | 1.2197 |
| 1 | Today Daily Change | -0.0017 |
| 2 | Today Daily Change % | -0.1400 |
| 3 | Today daily open | 1.2214 |
The pair remains strongly bullish on the daily timeframe. It trades above its 20 SMA @ 1.2084, 50 SMA 1.202, 100 SMA @ 1.1683 and 200 SMA @ 1.2001.
| Trends | Trends.1 | |
|---|---|---|
| 0 | Daily SMA20 | 1.2084 |
| 1 | Daily SMA50 | 1.2020 |
| 2 | Daily SMA100 | 1.1683 |
| 3 | Daily SMA200 | 1.2001 |
The previous day high was 1.2247 while the previous day low was 1.2088. The daily 38.2% Fib levels comes at 1.2186, expected to provide support. Similarly, the daily 61.8% fib level is at 1.2149, expected to provide support.
Note the levels of interest below:
- Pivot support is noted at 1.212, 1.2025, 1.1961
- Pivot resistance is noted at 1.2278, 1.2342, 1.2437
| Levels | Levels.1 |
|---|---|
| Previous Daily High | 1.2247 |
| Previous Daily Low | 1.2088 |
| Previous Weekly High | 1.2102 |
| Previous Weekly Low | 1.1841 |
| Previous Monthly High | 1.2447 |
| Previous Monthly Low | 1.1992 |
| Daily Fibonacci 38.2% | 1.2186 |
| Daily Fibonacci 61.8% | 1.2149 |
| Daily Pivot Point S1 | 1.2120 |
| Daily Pivot Point S2 | 1.2025 |
| Daily Pivot Point S3 | 1.1961 |
| Daily Pivot Point R1 | 1.2278 |
| Daily Pivot Point R2 | 1.2342 |
| Daily Pivot Point R3 | 1.2437 |
[/s2If]
Join Our Telegram Group
")


