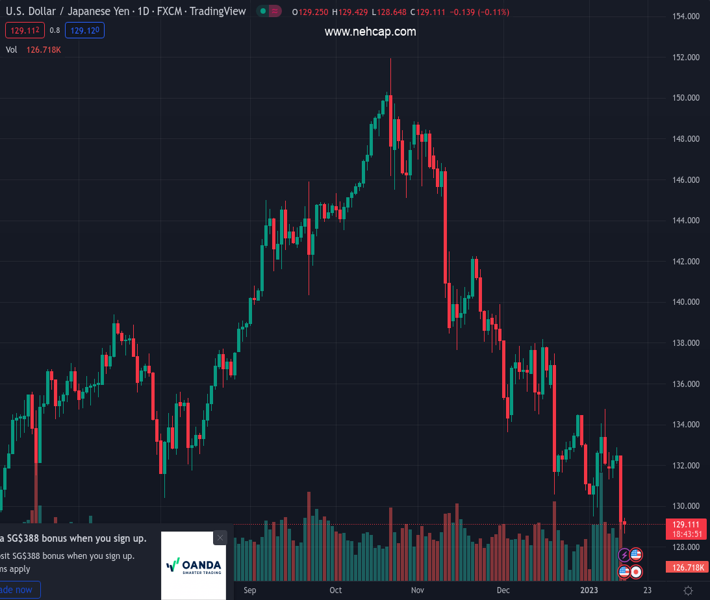
#USDJPY @ 129.112 has gauged intermediate support around 129.00 after a vertical fall. (Pivot Orderbook analysis)
…
This is a premium post.
[s2If !current_user_can(access_s2member_level4)]Please register for PREMIUM VERSION HERE to read full post below containing analysis. In case of any error or you think you are not able to read the full post below, please email us at support#nehcap.com [lwa][/s2If] [s2If current_user_can(access_s2member_level4)]
- USD/JPY has gauged intermediate support around 129.00 after a vertical fall.
- Ease in risk-on market mood has provided support to the US Treasury yields.
- A downtrend in the US inflation has accelerated the odds of less hawkish monetary policy by the Fed.
The pair currently trades last at 129.112.
The previous day high was 132.56 while the previous day low was 128.87. The daily 38.2% Fib levels comes at 130.28, expected to provide resistance. Similarly, the daily 61.8% fib level is at 131.15, expected to provide resistance.
The USD/JPY pair has sensed support around 129.00 in the Tokyo session after a vertical downfall below the critical support of 132.30 on Thursday. The asset witnessed extreme selling pressure after the continuation of the downward spree of the United States inflation.
After a massive selloff, the asset has gauged an intermediate cushion as the risk-sensitive asset has sensed long liquidation. The S&P500 futures have picked offers in Asia after a three-day consecutive rally, portraying a loss of strength in the risk-appetite theme. This has led to a decline in the demand for US government bonds. The 10-year US Treasury yields have gained to near 3.49%.
Meanwhile, the US Dollar Index (DXY) is attempting to overstep the immediate resistance of 102.00. A rebound move in the USD Index has been supported by the ease in the cheerful market mood. However, the downside bias for the USD Index is still solid as the headline US inflation has dropped to 6.5% from its peak of 9.1% in a few months.
A meaningful downtrend in the US Consumer Price Index (CPI) has triggered odds of less-hawkish commentary by Federal Reserve (Fed) chair Jerome Powell in the upcoming monetary policy meeting. While other Fed policymakers have trimmed their expectations for the continuation of a higher interest rate announcement. Philadelphia Fed Bank President Patrick Harker said on Thursday that it was time for future Fed rate hikes to shift to 25 basis points (bps) increments, as reported by Reuters.
On the Tokyo front, the Bank of Japan (BoJ) has announced that it will review the side effects of a secular period-long ultra-expansionary monetary policy. This doesn’t convey that the central bank will start turning hawkish on interest rates as the maintenance of the 2% inflation target is still difficult for the BoJ. However, the central bank will restrict sheer liquidity leakage to improve market functioning.
Technical Levels: Supports and Resistances
USDJPY currently trading at 129.17 at the time of writing. Pair opened at 129.2 and is trading with a change of -0.02 % .
| Overview | Overview.1 | |
|---|---|---|
| 0 | Today last price | 129.17 |
| 1 | Today Daily Change | -0.03 |
| 2 | Today Daily Change % | -0.02 |
| 3 | Today daily open | 129.20 |
The pair remains strongly bearish on the daily time frame. It trades below the 20 SMA @ 132.69, 50 SMA 136.67, 100 SMA @ 140.72 and 200 SMA @ 136.62.
| Trends | Trends.1 | |
|---|---|---|
| 0 | Daily SMA20 | 132.69 |
| 1 | Daily SMA50 | 136.67 |
| 2 | Daily SMA100 | 140.72 |
| 3 | Daily SMA200 | 136.62 |
The previous day high was 132.56 while the previous day low was 128.87. The daily 38.2% Fib levels comes at 130.28, expected to provide resistance. Similarly, the daily 61.8% fib level is at 131.15, expected to provide resistance.
Note the levels of interest below:
- Pivot support is noted at 127.86, 126.52, 124.17
- Pivot resistance is noted at 131.55, 133.9, 135.24
| Levels | Levels.1 |
|---|---|
| Previous Daily High | 132.56 |
| Previous Daily Low | 128.87 |
| Previous Weekly High | 134.78 |
| Previous Weekly Low | 129.51 |
| Previous Monthly High | 138.18 |
| Previous Monthly Low | 130.57 |
| Daily Fibonacci 38.2% | 130.28 |
| Daily Fibonacci 61.8% | 131.15 |
| Daily Pivot Point S1 | 127.86 |
| Daily Pivot Point S2 | 126.52 |
| Daily Pivot Point S3 | 124.17 |
| Daily Pivot Point R1 | 131.55 |
| Daily Pivot Point R2 | 133.90 |
| Daily Pivot Point R3 | 135.24 |
[/s2If]
Join Our Telegram Group
")


