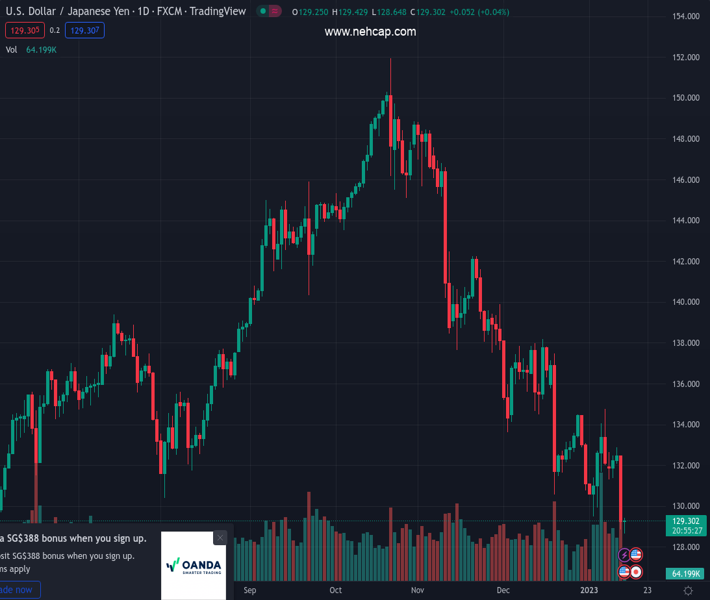
#USDJPY @ 129.213 bears take on the bulls and extend the downside. (Pivot Orderbook analysis)
…
This is a premium post.
[s2If !current_user_can(access_s2member_level4)]Please register for PREMIUM VERSION HERE to read full post below containing analysis. In case of any error or you think you are not able to read the full post below, please email us at support#nehcap.com [lwa][/s2If] [s2If current_user_can(access_s2member_level4)]
- USD/JPY bears take on the bulls and extend the downside.
- A fresh low has been pointed as the BoJ and Fed sentiment run over the bulls.
The pair currently trades last at 129.213.
The previous day high was 132.56 while the previous day low was 128.87. The daily 38.2% Fib levels comes at 130.28, expected to provide resistance. Similarly, the daily 61.8% fib level is at 131.15, expected to provide resistance.
USD/JPY is pressured and on the offer following a series of impactful macro events, both scheduled and unscheduled, including the Bank of Japan headlines (Wednesday) and US Consumer Price Index (Thursday). At the time of writing, the pair is lower by some 0.20% trading around 129.00 and within a range of 128.64 and 129.42.
USD/JPY fell out of bed on Wednesday before the highly anticipated Consumer Price Index event on Thursday when a headline did the rounds that the Bank of Japan, as reported by Japanese media Yomiuri, was about to make another hawkish move during its next week’s monetary policy meeting. The news signalled that the Japanese central bank is up for reviewing the side effects of massive monetary easing in the monetary policy meeting next week. “BoJ reviews due to skewed interest rates in markets even after last month’s tweak in bond yield control policy,” adds Yomiuri per Reuters. As a consequence, the yen rallied hard from trendline resistance to break 130 and reached 129.60. In trade today, the yen is benefiting from Japanese Government Bond yields rising on the hawkish sentiment.
On Thursday, the yen gained more ground to a high of 128.85 following the Consumer Price Index data that came in as expected on the whole. The data have helped cement expectations for a 25bp Fed hike next month, and the resulting drop in US bond yields has weighed on the greenback. The year-over-year CPI print landed at 6.5% or 0.6 of a percentage point cooler than the November number. The one exception was a positive surprise. On a monthly basis, the headline number actually decreased by a nominal 0.1% instead of remaining unchanged, as analysts expected.
However, there are observers that are sceptical of the Federal Reserve.
Analysts at Brown Brothers Harriman argued that ”core PCE has largely been in a 4.5-5.5% range since November 2021 and we think the Fed needs to see further improvement before even contemplating any sort of pivot.”
”WIRP suggests a 25 bp hike February 1 is fully priced in, with nearly 30% odds of a larger 50 bp move. Another 25 bp hike March 22 is fully priced in, while one last 25 bp hike in Q2 is nearly 45% priced in that would take the Fed Funds rate ceiling up to 5.25%. However, the swaps market continues to price in an easing cycle by year-end and we just don’t see that happening.”
Technical Levels: Supports and Resistances
USDJPY currently trading at 128.9 at the time of writing. Pair opened at 129.2 and is trading with a change of -0.23 % .
| Overview | Overview.1 | |
|---|---|---|
| 0 | Today last price | 128.90 |
| 1 | Today Daily Change | -0.30 |
| 2 | Today Daily Change % | -0.23 |
| 3 | Today daily open | 129.20 |
The pair remains strongly bearish on the daily time frame. It trades below the 20 SMA @ 132.69, 50 SMA 136.67, 100 SMA @ 140.72 and 200 SMA @ 136.62.
| Trends | Trends.1 | |
|---|---|---|
| 0 | Daily SMA20 | 132.69 |
| 1 | Daily SMA50 | 136.67 |
| 2 | Daily SMA100 | 140.72 |
| 3 | Daily SMA200 | 136.62 |
The previous day high was 132.56 while the previous day low was 128.87. The daily 38.2% Fib levels comes at 130.28, expected to provide resistance. Similarly, the daily 61.8% fib level is at 131.15, expected to provide resistance.
Note the levels of interest below:
- Pivot support is noted at 127.86, 126.52, 124.17
- Pivot resistance is noted at 131.55, 133.9, 135.24
| Levels | Levels.1 |
|---|---|
| Previous Daily High | 132.56 |
| Previous Daily Low | 128.87 |
| Previous Weekly High | 134.78 |
| Previous Weekly Low | 129.51 |
| Previous Monthly High | 138.18 |
| Previous Monthly Low | 130.57 |
| Daily Fibonacci 38.2% | 130.28 |
| Daily Fibonacci 61.8% | 131.15 |
| Daily Pivot Point S1 | 127.86 |
| Daily Pivot Point S2 | 126.52 |
| Daily Pivot Point S3 | 124.17 |
| Daily Pivot Point R1 | 131.55 |
| Daily Pivot Point R2 | 133.90 |
| Daily Pivot Point R3 | 135.24 |
[/s2If]
Join Our Telegram Group
")


