#XAGUSD @ 23.749 US Dollar tumbles and then soars after US CPI numbers. (Pivot Orderbook analysis)
…
This is a premium post.
[s2If !current_user_can(access_s2member_level4)]Please register for PREMIUM VERSION HERE to read full post below containing analysis. In case of any error or you think you are not able to read the full post below, please email us at support#nehcap.com [lwa][/s2If] [s2If current_user_can(access_s2member_level4)]
- US Dollar tumbles and then soars after US CPI numbers.
- Volatile session across financial markets, US stocks back in positive ground.
- XAG/USD trims daily gains after being unable to hold above $24.00
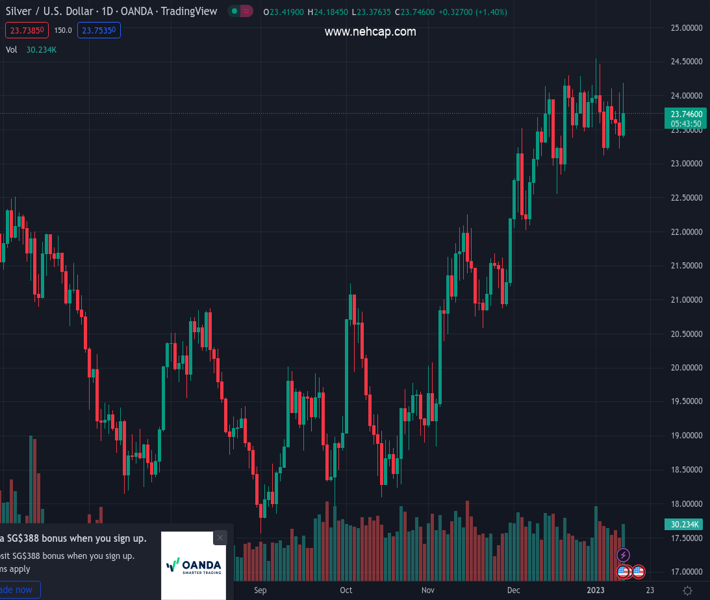
The pair currently trades last at 23.749.
The previous day high was 24.04 while the previous day low was 23.22. The daily 38.2% Fib levels comes at 23.53, expected to provide support. Similarly, the daily 61.8% fib level is at 23.73, expected to provide support.
Silver prices soared after the release of US inflation data but then pulled back amid a recovery of the US Dollar. XAG/USD peaked at $24.17, the highest level in a week and then pulled back all the way down to the $23.60 zone. It is hovering around $23.75, positive for the day but off highs.
The US Consumer Price Index fell in December 0.1% and the annual rate slowed to 6.5% from 7.1%, reaching the lowest level since October 2021. The number came in line with expectations and contribute to anchor expectations for shift in Federal Reserve rate hike to 25 basis points increments.
US yields tumbled after the report boosting Gold prices that helped also Silver. Following Wall Street’s opening bell market sentiment deteriorated and yields rebounded, triggering a retreat in XAU/USD and XAG/USD.
Silver prices again were rejected from above $24.00. A consolidation above that area could open the doors to further gains. The next resistance is at $24.20 followed by $24.55 (Jan 3 high).
Initial support emerges at the 20-day Simple Moving Average (SMA), near $23.60; below an uptrend line emerges around $23.35. A break below $23.30 could trigger a bearish acceleration, exposing $23.00.
Technical Levels: Supports and Resistances
XAGUSD currently trading at 23.74 at the time of writing. Pair opened at 23.42 and is trading with a change of 1.37 % .
| Overview | Overview.1 | |
|---|---|---|
| 0 | Today last price | 23.74 |
| 1 | Today Daily Change | 0.32 |
| 2 | Today Daily Change % | 1.37 |
| 3 | Today daily open | 23.42 |
The pair remains strongly bullish on the daily timeframe. It trades above its 20 SMA @ 23.66, 50 SMA 22.56, 100 SMA @ 20.85 and 200 SMA @ 21.09.
| Trends | Trends.1 | |
|---|---|---|
| 0 | Daily SMA20 | 23.66 |
| 1 | Daily SMA50 | 22.56 |
| 2 | Daily SMA100 | 20.85 |
| 3 | Daily SMA200 | 21.09 |
The previous day high was 24.04 while the previous day low was 23.22. The daily 38.2% Fib levels comes at 23.53, expected to provide support. Similarly, the daily 61.8% fib level is at 23.73, expected to provide support.
Note the levels of interest below:
- Pivot support is noted at 23.07, 22.73, 22.25
- Pivot resistance is noted at 23.9, 24.38, 24.72
| Levels | Levels.1 |
|---|---|
| Previous Daily High | 24.04 |
| Previous Daily Low | 23.22 |
| Previous Weekly High | 24.55 |
| Previous Weekly Low | 23.12 |
| Previous Monthly High | 24.30 |
| Previous Monthly Low | 22.03 |
| Daily Fibonacci 38.2% | 23.53 |
| Daily Fibonacci 61.8% | 23.73 |
| Daily Pivot Point S1 | 23.07 |
| Daily Pivot Point S2 | 22.73 |
| Daily Pivot Point S3 | 22.25 |
| Daily Pivot Point R1 | 23.90 |
| Daily Pivot Point R2 | 24.38 |
| Daily Pivot Point R3 | 24.72 |
[/s2If]
Join Our Telegram Group
")


