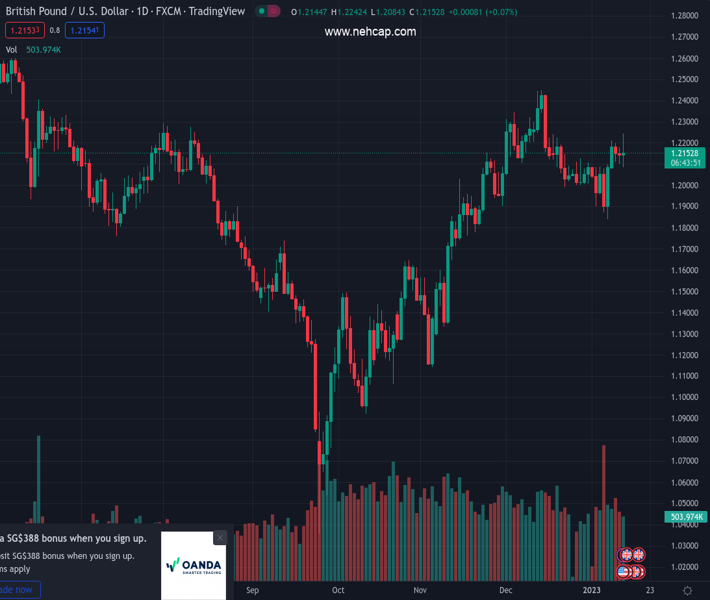
#GBPUSD @ 1.21465 US Dollar tumbles after CPI data, trims losses after Wall Street opening bell. (Pivot Orderbook analysis)
…
This is a premium post.
[s2If !current_user_can(access_s2member_level4)]Please register for PREMIUM VERSION HERE to read full post below containing analysis. In case of any error or you think you are not able to read the full post below, please email us at support#nehcap.com [lwa][/s2If] [s2If current_user_can(access_s2member_level4)]
- US Dollar tumbles after CPI data, trims losses after Wall Street opening bell.
- Inflation confirms slowdown in the US, Fed’s Harker expects 25 bps hikes now.
- GBP/USD reveres sharply, drops below 1.2100.
The pair currently trades last at 1.21465.
The previous day high was 1.2179 while the previous day low was 1.21. The daily 38.2% Fib levels comes at 1.213, expected to provide support. Similarly, the daily 61.8% fib level is at 1.2149, expected to provide resistance.
On a volatile session for FX, the US Dollar has reversed sharply during the last hour and turned positive across the board. The GBP/USD peaked after the release of US inflation data at 1.2244, the highest level in four weeks and as of writing, it is trading below 1.2100, at the lowest since Monday.
Inflation data triggered a decline of the US Dollar that then recovered as equity prices in Wall Street dropped following the opening bell. The US Consumer Price Index fell in December 0.1% and the annual rate slowed to 6.5% from 7.1%, reaching the lowest level since October 2021.
Following the inflation numbers, Patrick Harker, President of the Federal Reserve Bank of Philadelphia, said it was time for future Fed rate hikes to shift to 25 basis points increments. His comments added fuel to the decline of the greenback as US yields sank.
Equity prices in Wall Street turned negative after the opening. The deterioration in market sentiment was accompanied by a rebound in US yields. The US Dollar reversed its course and rose sharply, erasing all US CPI-losses.
The GBP/USD is struggling to hold above 1.2100 as markets continue to digest CPI numbers and the Dollar keeps looking for a direction. The Pound also weakened during the last hour versus the Euro, with EUR/GBP surging to 0.8890, the highest level since late September.
Technical Levels: Supports and Resistances
GBPUSD currently trading at 1.2139 at the time of writing. Pair opened at 1.2146 and is trading with a change of -0.06 % .
| Overview | Overview.1 | |
|---|---|---|
| 0 | Today last price | 1.2139 |
| 1 | Today Daily Change | -0.0007 |
| 2 | Today Daily Change % | -0.0600 |
| 3 | Today daily open | 1.2146 |
The pair remains strongly bullish on the daily timeframe. It trades above its 20 SMA @ 1.2082, 50 SMA 1.1999, 100 SMA @ 1.168 and 200 SMA @ 1.2005.
| Trends | Trends.1 | |
|---|---|---|
| 0 | Daily SMA20 | 1.2082 |
| 1 | Daily SMA50 | 1.1999 |
| 2 | Daily SMA100 | 1.1680 |
| 3 | Daily SMA200 | 1.2005 |
The previous day high was 1.2179 while the previous day low was 1.21. The daily 38.2% Fib levels comes at 1.213, expected to provide support. Similarly, the daily 61.8% fib level is at 1.2149, expected to provide resistance.
Note the levels of interest below:
- Pivot support is noted at 1.2105, 1.2064, 1.2027
- Pivot resistance is noted at 1.2183, 1.222, 1.2261
| Levels | Levels.1 |
|---|---|
| Previous Daily High | 1.2179 |
| Previous Daily Low | 1.2100 |
| Previous Weekly High | 1.2102 |
| Previous Weekly Low | 1.1841 |
| Previous Monthly High | 1.2447 |
| Previous Monthly Low | 1.1992 |
| Daily Fibonacci 38.2% | 1.2130 |
| Daily Fibonacci 61.8% | 1.2149 |
| Daily Pivot Point S1 | 1.2105 |
| Daily Pivot Point S2 | 1.2064 |
| Daily Pivot Point S3 | 1.2027 |
| Daily Pivot Point R1 | 1.2183 |
| Daily Pivot Point R2 | 1.2220 |
| Daily Pivot Point R3 | 1.2261 |
[/s2If]
Join Our Telegram Group
")


