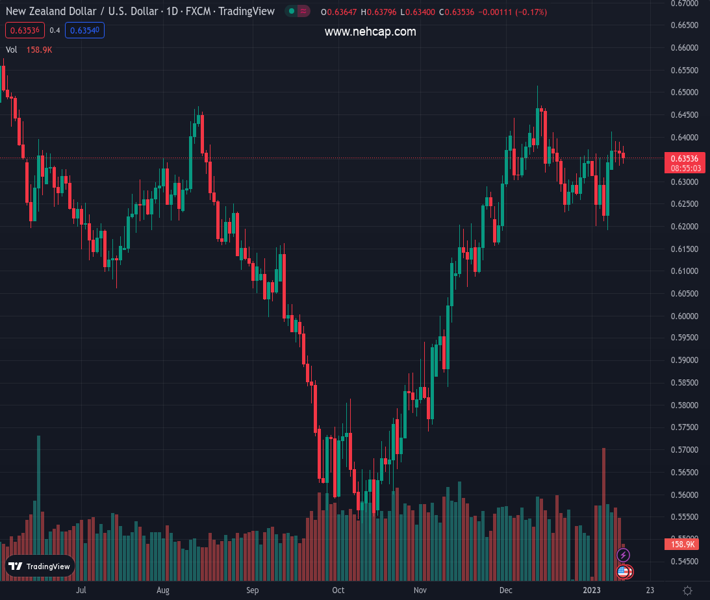
#NZDUSD @ 0.63536 comes under some selling pressure on Thursday, though lacks follow-through. (Pivot Orderbook analysis)
…
This is a premium post.
[s2If !current_user_can(access_s2member_level4)]Please register for PREMIUM VERSION HERE to read full post below containing analysis. In case of any error or you think you are not able to read the full post below, please email us at support#nehcap.com [lwa][/s2If] [s2If current_user_can(access_s2member_level4)]
- NZD/USD comes under some selling pressure on Thursday, though lacks follow-through.
- Bets for smaller Fed rate hikes, sliding US bond yields weigh on the USD and lend support.
- Investors also seem reluctant to place aggressive bets ahead of the crucial US CPI report.
The pair currently trades last at 0.63536.
The previous day high was 0.6401 while the previous day low was 0.6335. The daily 38.2% Fib levels comes at 0.636, expected to provide resistance. Similarly, the daily 61.8% fib level is at 0.6376, expected to provide resistance.
The NZD/USD pair edges lower on Thursday and remains on the defensive through the mid-European session, through lack follow-through selling. The pair is currently placed around the mid-0.6300s as traders keenly await the release of the latest US consumer inflation figures.
The crucial US CPI report will influence the Federal Reserve’s rate-hiking path, which, in turn, will drive the US Dollar demand and provide a fresh directional impetus to the NZD/USD pair. The market anxiety ahead of the key macro data benefits the greenback’s relative safe-haven status and is seen undermining the risk-sensitive Kiwi.
That said, rising bets for smaller Fed rate hikes, along with a positive risk tone, weigh on the USD and help limit the downside for the NZD/USD pair. Market players seem convinced that the US central bank will soften its hawkish stance amid initial signs of easing inflationary pressure, which is evident from sliding US Treasury bond yields.
In fact, the yield on the benchmark 10-year US Treasury note languishes near a multi-week low and keeps the USD depressed near a seven-month low touched earlier this week. This makes it prudent to wait for strong follow-through selling before confirming that the NZD/USD pair has topped out in the near term and positioning for any meaningful corrective slide.
Technical Levels: Supports and Resistances
NZDUSD currently trading at 0.635 at the time of writing. Pair opened at 0.6366 and is trading with a change of -0.25 % .
| Overview | Overview.1 | |
|---|---|---|
| 0 | Today last price | 0.6350 |
| 1 | Today Daily Change | -0.0016 |
| 2 | Today Daily Change % | -0.2500 |
| 3 | Today daily open | 0.6366 |
The pair remains strongly bullish on the daily timeframe. It trades above its 20 SMA @ 0.632, 50 SMA 0.6246, 100 SMA @ 0.6045 and 200 SMA @ 0.6216.
| Trends | Trends.1 | |
|---|---|---|
| 0 | Daily SMA20 | 0.6320 |
| 1 | Daily SMA50 | 0.6246 |
| 2 | Daily SMA100 | 0.6045 |
| 3 | Daily SMA200 | 0.6216 |
The previous day high was 0.6401 while the previous day low was 0.6335. The daily 38.2% Fib levels comes at 0.636, expected to provide resistance. Similarly, the daily 61.8% fib level is at 0.6376, expected to provide resistance.
Note the levels of interest below:
- Pivot support is noted at 0.6333, 0.6301, 0.6267
- Pivot resistance is noted at 0.64, 0.6433, 0.6466
| Levels | Levels.1 |
|---|---|
| Previous Daily High | 0.6401 |
| Previous Daily Low | 0.6335 |
| Previous Weekly High | 0.6363 |
| Previous Weekly Low | 0.6190 |
| Previous Monthly High | 0.6514 |
| Previous Monthly Low | 0.6230 |
| Daily Fibonacci 38.2% | 0.6360 |
| Daily Fibonacci 61.8% | 0.6376 |
| Daily Pivot Point S1 | 0.6333 |
| Daily Pivot Point S2 | 0.6301 |
| Daily Pivot Point S3 | 0.6267 |
| Daily Pivot Point R1 | 0.6400 |
| Daily Pivot Point R2 | 0.6433 |
| Daily Pivot Point R3 | 0.6466 |
[/s2If]
Join Our Telegram Group
")


