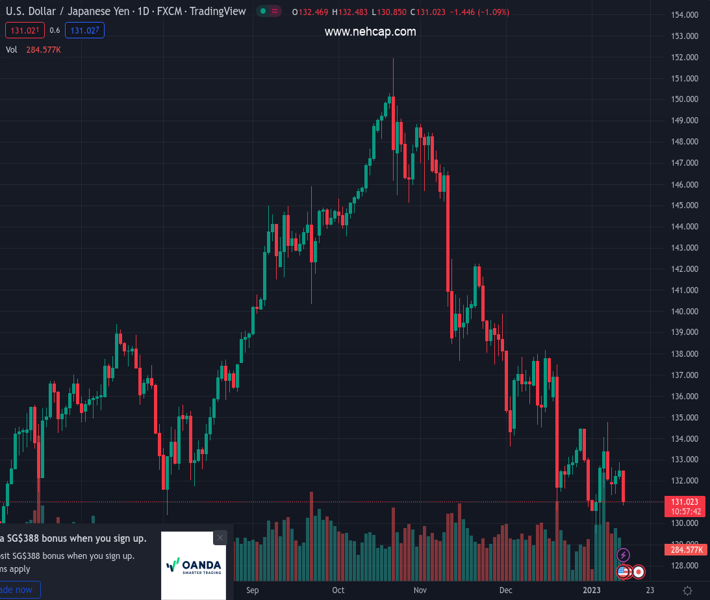
#USDJPY @ 131.008 drops to over a one-week low on Thursday and is pressured by a combination of factors. (Pivot Orderbook analysis)
…
This is a premium post.
[s2If !current_user_can(access_s2member_level4)]Please register for PREMIUM VERSION HERE to read full post below containing analysis. In case of any error or you think you are not able to read the full post below, please email us at support#nehcap.com [lwa][/s2If] [s2If current_user_can(access_s2member_level4)]
- USD/JPY drops to over a one-week low on Thursday and is pressured by a combination of factors.
- Reports that the BoJ will review the effects of its ultra-loose policy provides a strong lift to the JPY.
- Rising bets for smaller Fed rate hikes keep the US bond yields depressed and undermine the USD.
- Traders now look forward to the crucial US CPI report for some meaningful directional impetus.
The pair currently trades last at 131.008.
The previous day high was 132.87 while the previous day low was 132.06. The daily 38.2% Fib levels comes at 132.56, expected to provide resistance. Similarly, the daily 61.8% fib level is at 132.37, expected to provide resistance.
The USD/JPY pair comes under heavy selling pressure on Thursday and continues losing ground through the first half of the European session. The downward trajectory drags spot prices to over a one-week low in the last hour, with bears now awaiting a sustained break below the 131.00 round-figure mark.
The Japanese Yen strengthens across the board amid reports that the Bank of Japan (BoJ) will review the side effects of its ultra-loose monetary policy at the next policy meeting on January 17-18. Further details showed that policymakers may take additional steps to correct distortions in the yield curve. This comes on the back of the BoJ’s surprise tweak in December and fuels speculation for an eventual tightening later this year. This, along with the prevalent US Dollar selling bias, drags the USD/JPY pair lower.
The USD Index, which measures the greenback’s performance against a basket of currencies, languishes near a seven-month low touched earlier this week amid rising bets for smaller Fed rate hikes. The bets were lifted by last week’s mixed US monthly jobs report (NFP), which showed a slowdown in wage growth during December. The data pointed to easing inflationary pressure, which could allow the US central bank to soften its hawkish stance. This keeps the US Treasury bond yields depressed and weighs on the USD.
With the latest leg down, the USD/JPY pair confirms a breakdown through a three-day-old trading range and seems vulnerable to sliding further. Traders, however, might be reluctant to place aggressive bearish bets and prefer to wait for the latest US consumer inflation figures. The crucial US CPI report is due for release later during the early North American session and will play a key role in influencing the Fed’s rate hike path. This, in turn, will drive the USD demand and provide a fresh directional impetus to the major.
Technical Levels: Supports and Resistances
USDJPY currently trading at 131.1 at the time of writing. Pair opened at 132.53 and is trading with a change of -1.08 % .
| Overview | Overview.1 | |
|---|---|---|
| 0 | Today last price | 131.10 |
| 1 | Today Daily Change | -1.43 |
| 2 | Today Daily Change % | -1.08 |
| 3 | Today daily open | 132.53 |
The pair remains strongly bearish on the daily time frame. It trades below the 20 SMA @ 133.12, 50 SMA 137.05, 100 SMA @ 140.8 and 200 SMA @ 136.59.
| Trends | Trends.1 | |
|---|---|---|
| 0 | Daily SMA20 | 133.12 |
| 1 | Daily SMA50 | 137.05 |
| 2 | Daily SMA100 | 140.80 |
| 3 | Daily SMA200 | 136.59 |
The previous day high was 132.87 while the previous day low was 132.06. The daily 38.2% Fib levels comes at 132.56, expected to provide resistance. Similarly, the daily 61.8% fib level is at 132.37, expected to provide resistance.
Note the levels of interest below:
- Pivot support is noted at 132.1, 131.67, 131.29
- Pivot resistance is noted at 132.92, 133.3, 133.73
| Levels | Levels.1 |
|---|---|
| Previous Daily High | 132.87 |
| Previous Daily Low | 132.06 |
| Previous Weekly High | 134.78 |
| Previous Weekly Low | 129.51 |
| Previous Monthly High | 138.18 |
| Previous Monthly Low | 130.57 |
| Daily Fibonacci 38.2% | 132.56 |
| Daily Fibonacci 61.8% | 132.37 |
| Daily Pivot Point S1 | 132.10 |
| Daily Pivot Point S2 | 131.67 |
| Daily Pivot Point S3 | 131.29 |
| Daily Pivot Point R1 | 132.92 |
| Daily Pivot Point R2 | 133.30 |
| Daily Pivot Point R3 | 133.73 |
[/s2If]
Join Our Telegram Group
")


