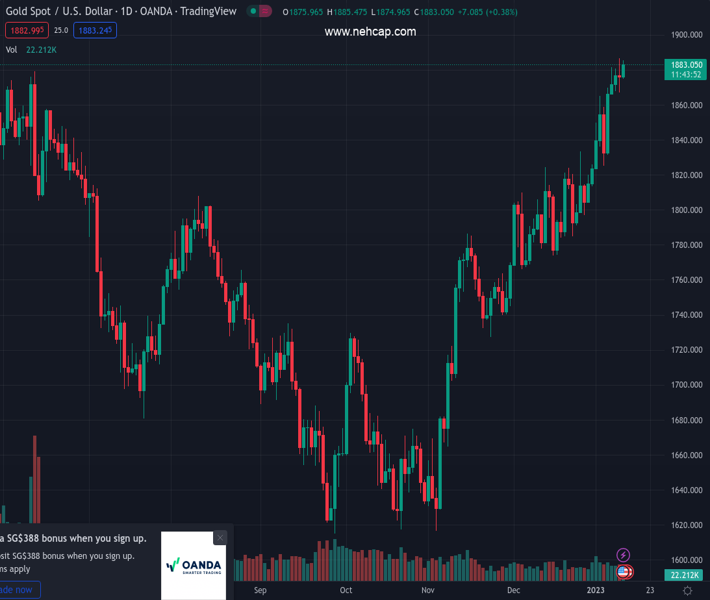
#XAUUSD @ 1,883.26 Gold price catches fresh bids on Thursday and climbs back closer to a multi-month peak. (Pivot Orderbook analysis)
…
This is a premium post.
[s2If !current_user_can(access_s2member_level4)]Please register for PREMIUM VERSION HERE to read full post below containing analysis. In case of any error or you think you are not able to read the full post below, please email us at support#nehcap.com [lwa][/s2If] [s2If current_user_can(access_s2member_level4)]
- Gold price catches fresh bids on Thursday and climbs back closer to a multi-month peak.
- Bets for less aggressive Federal Reserve continues to lend some support to the XAU/USD.
- Sliding US Treasury bond yields weighs on the US Dollar and provides an additional boost.
- The market focus remains glued to the consumer inflation figures from the United States.
The pair currently trades last at 1883.26.
The previous day high was 1886.67 while the previous day low was 1867.13. The daily 38.2% Fib levels comes at 1874.59, expected to provide support. Similarly, the daily 61.8% fib level is at 1879.21, expected to provide support.
Gold price attracts some dip-buying on Thursday and steadily climbs back closer to an eight-month high touched the previous day.
Currently placed around the $1,885 area, the Gold price seems poised to appreciate further amid hopes for a less aggressive policy tightening by the Federal Reserve (Fed). Investors seem convinced that the Fed will soften its hawkish stance and pause the current rate-hiking cycle amid initial signs of easing inflationary pressures. Hence, the market focus will remain glued to the release of the latest consumer inflation figures from the United States (US), due later during the early North American session.
In the meantime, rising bets for smaller Fed rate hikes going forward keep the US Treasury bond yields depressed and continues to lend some support to the non-yielding Gold price. In fact, the yield on the benchmark 10-year US Treasury note languishes near a multi-week low and weighs on the US Dollar (USD). This is seen as another factor acting as a tailwind for the US Dollar-denominated XAU/USD and supports prospects for additional gains. Traders, however, might prefer to wait on the sidelines ahead of the key data risk.
The crucial US CPI report will influence the Fed’s near-term policy outlook. Officials, meanwhile, had indicated that they remain committed to combat high inflation and that rates could remain elevated for longer, or until there is clear evidence that consumer prices are falling. Hence, a stronger US CPI print will lift bets for a more hawkish Fed and push the buck higher. Conversely, a softer reading should pave the way for additional USD losses. Nevertheless, the data will provide a fresh directional impetus to Gold price.
From a technical perspective, the stage seems all set for a move towards reclaiming the $1,900 round-figure mark for the first time since May 2022. Some follow-through buying will be seen as a fresh trigger for bullish traders and open the doors for a further near-term appreciating move. On the flip side, any meaningful corrective slide now seems to find decent support near the $1,865-$1,860 strong resistance breakpoint. Sustained weakness below might prompt some technical selling and drag the Gold price to the $1,835-$1,833 horizontal support.
Technical Levels: Supports and Resistances
XAUUSD currently trading at 1884.45 at the time of writing. Pair opened at 1876.52 and is trading with a change of 0.42 % .
| Overview | Overview.1 | |
|---|---|---|
| 0 | Today last price | 1884.45 |
| 1 | Today Daily Change | 7.93 |
| 2 | Today Daily Change % | 0.42 |
| 3 | Today daily open | 1876.52 |
The pair remains strongly bullish on the daily timeframe. It trades above its 20 SMA @ 1823.72, 50 SMA 1782.87, 100 SMA @ 1730.86 and 200 SMA @ 1777.31.
| Trends | Trends.1 | |
|---|---|---|
| 0 | Daily SMA20 | 1823.72 |
| 1 | Daily SMA50 | 1782.87 |
| 2 | Daily SMA100 | 1730.86 |
| 3 | Daily SMA200 | 1777.31 |
The previous day high was 1886.67 while the previous day low was 1867.13. The daily 38.2% Fib levels comes at 1874.59, expected to provide support. Similarly, the daily 61.8% fib level is at 1879.21, expected to provide support.
Note the levels of interest below:
- Pivot support is noted at 1866.88, 1857.23, 1847.34
- Pivot resistance is noted at 1886.42, 1896.31, 1905.96
| Levels | Levels.1 |
|---|---|
| Previous Daily High | 1886.67 |
| Previous Daily Low | 1867.13 |
| Previous Weekly High | 1869.91 |
| Previous Weekly Low | 1823.76 |
| Previous Monthly High | 1833.38 |
| Previous Monthly Low | 1765.89 |
| Daily Fibonacci 38.2% | 1874.59 |
| Daily Fibonacci 61.8% | 1879.21 |
| Daily Pivot Point S1 | 1866.88 |
| Daily Pivot Point S2 | 1857.23 |
| Daily Pivot Point S3 | 1847.34 |
| Daily Pivot Point R1 | 1886.42 |
| Daily Pivot Point R2 | 1896.31 |
| Daily Pivot Point R3 | 1905.96 |
[/s2If]
Join Our Telegram Group


