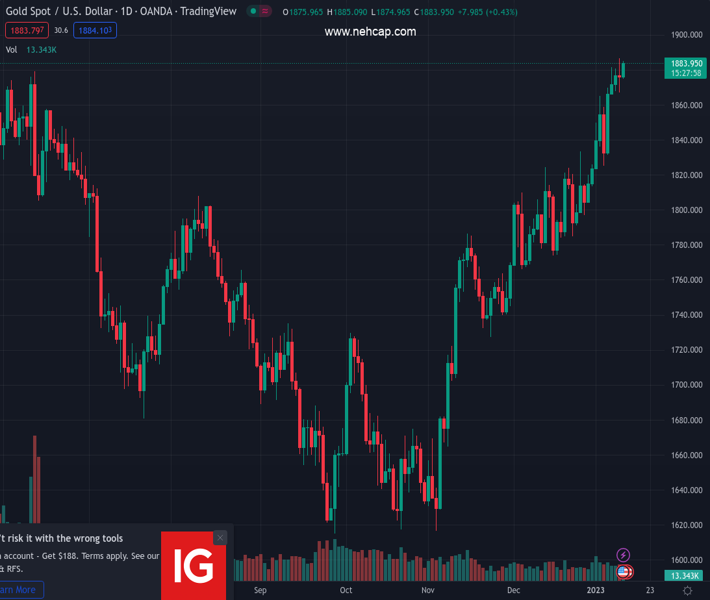
#XAUUSD @ 1,883.62 Gold price remain firmer around the highest levels since May 2022., @nehcap view: Limited upside expected (Pivot Orderbook analysis)
…
This is a premium post.
[s2If !current_user_can(access_s2member_level4)]Please register for PREMIUM VERSION HERE to read full post below containing analysis. In case of any error or you think you are not able to read the full post below, please email us at support#nehcap.com [lwa][/s2If] [s2If current_user_can(access_s2member_level4)]
- Gold price remain firmer around the highest levels since May 2022.
- Resistance-turned-support from mid-November, upbeat China CPI put a floor under XAU/USD price.
- Downbeat market consensus for US CPI, Fed’s hesitance keeps Gold buyers hopeful.
The pair currently trades last at 1883.62.
The previous day high was 1886.67 while the previous day low was 1867.13. The daily 38.2% Fib levels comes at 1874.59, expected to provide support. Similarly, the daily 61.8% fib level is at 1879.21, expected to provide support.
Gold price (XAU/USD) clings to mild gains around $1,885 as expectations for softer US inflation underpin cautious optimism during early Thursday. As a result, the US Dollar keeps the recent bearish bias while tracking downbeat US Treasury yields.
That said, the US 10-year Treasury yields dropped two basis points (bps) to 3.53% while the US two-year bond coupons also traced the 10-year counterpart and print mild losses at around 4.21% at the latest.
Not only the downbeat yields but mildly bid US stock futures and dovish comments from Federal Reserve Bank of Boston President Susan Collins also weigh on the US Dollar. With this, the US Dollar Index (DXY) prints mild losses around 103.10 as bears poke the lowest levels marked since early June, tested earlier in the last week.
Furthermore, the risk-positive headlines from China’s National Development and Reform Commission (NDRC) and China’s firmer Consumer Price Index (CPI) for December add strength to the Gold buying.
It’s worth observing that market forecasts of softer US CPI data for December, expected 6.5% YoY versus 7.1% prior, also favor the XAU/USD buyers. That said, the Core CPI, namely the CPI ex Food & Energy, will be observed closely for clear directions and is expected to be 5.7% versus 6.0% prior.
Gold price ignores the previous bearish Doji candlestick to remain firmer above the resistance line from mid-November, around $1,868 by the press time.
The yellow metal also pays little to the overbought RSI conditions, which in turn suggests that the XAU/USD buyers are running out of steam. Additionally, an area comprising lows marked during March 2022 around $1,890-95 and the $1,900 threshold also stands tall to challenge the Gold’s upside momentum.
As a result, the quote’s north-run appears limited unless it crosses the $1,900 threshold, a break of which could quickly propel it towards a late March 2022 swing high near $1,966 before highlighting the $2,000 psychological magnet for the XAU/USD bulls.
Alternatively, a downside break of the $1,870 support line, the previous resistance, could quickly drag the metal toward the one-month-old horizontal support near $1,822.
Following that, the 50-DMA and the 200-DMA could challenge the Gold sellers around $1,787 and $1,777 in that order.
Trend: Limited upside expected
Technical Levels: Supports and Resistances
XAUUSD currently trading at 1883.9 at the time of writing. Pair opened at 1876.52 and is trading with a change of 0.39% % .
| Overview | Overview.1 | |
|---|---|---|
| 0 | Today last price | 1883.9 |
| 1 | Today Daily Change | 7.38 |
| 2 | Today Daily Change % | 0.39% |
| 3 | Today daily open | 1876.52 |
The pair remains strongly bullish on the daily timeframe. It trades above its 20 SMA @ 1823.72, 50 SMA 1782.87, 100 SMA @ 1730.86 and 200 SMA @ 1777.31.
| Trends | Trends.1 | |
|---|---|---|
| 0 | Daily SMA20 | 1823.72 |
| 1 | Daily SMA50 | 1782.87 |
| 2 | Daily SMA100 | 1730.86 |
| 3 | Daily SMA200 | 1777.31 |
The previous day high was 1886.67 while the previous day low was 1867.13. The daily 38.2% Fib levels comes at 1874.59, expected to provide support. Similarly, the daily 61.8% fib level is at 1879.21, expected to provide support.
Note the levels of interest below:
- Pivot support is noted at 1866.88, 1857.23, 1847.34
- Pivot resistance is noted at 1886.42, 1896.31, 1905.96
| Levels | Levels.1 |
|---|---|
| Previous Daily High | 1886.67 |
| Previous Daily Low | 1867.13 |
| Previous Weekly High | 1869.91 |
| Previous Weekly Low | 1823.76 |
| Previous Monthly High | 1833.38 |
| Previous Monthly Low | 1765.89 |
| Daily Fibonacci 38.2% | 1874.59 |
| Daily Fibonacci 61.8% | 1879.21 |
| Daily Pivot Point S1 | 1866.88 |
| Daily Pivot Point S2 | 1857.23 |
| Daily Pivot Point S3 | 1847.34 |
| Daily Pivot Point R1 | 1886.42 |
| Daily Pivot Point R2 | 1896.31 |
| Daily Pivot Point R3 | 1905.96 |
[/s2If]
Join Our Telegram Group


