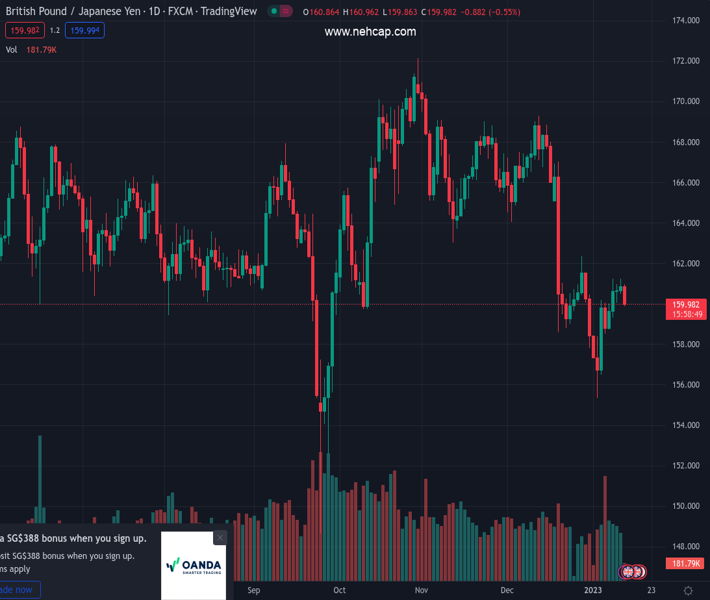
#GBPJPY @ 159.990 drops the most in a week while reversing from the key hurdle., @nehcap view: Bearish (Pivot Orderbook analysis)
…
This is a premium post.
[s2If !current_user_can(access_s2member_level4)]Please register for PREMIUM VERSION HERE to read full post below containing analysis. In case of any error or you think you are not able to read the full post below, please email us at support#nehcap.com [lwa][/s2If] [s2If current_user_can(access_s2member_level4)]
- GBP/JPY drops the most in a week while reversing from the key hurdle.
- Convergence of 21-DMA, fortnight-long descending trend line guards immediate upside.
- 61.8% Fibonacci retracement level lures bears, 164.30 appears strong resistance.
The pair currently trades last at 159.990.
The previous day high was 161.22 while the previous day low was 160.51. The daily 38.2% Fib levels comes at 160.95, expected to provide resistance. Similarly, the daily 61.8% fib level is at 160.78, expected to provide resistance.
GBP/JPY stands on the slippery ground as it renews its intraday low near 159.90 during early Thursday morning in London. In doing so, the cross-currency pair prints the first daily loss in five while declining the most in a week.
That said, the pair buyers’ inability to cross the 21-DMA and a two-week-old descending trend line, around 160.80, triggered the quote’s U-turn.
Also adding strength to the downside bias is the looming bear cross between the 50-DMA and the 100-DMA and the former pierces off the latter from above.
With this, the GBP/JPY price is declining towards the last Thursday’s swing low, around 158.50, before directing the bears to the 61.8% Fibonacci retracement level of the September-October upside of the pair, near 157.70.
In a case where the quote remains bearish past 157.70, a downwards-loping support line from December 20, near 153.25, will be important to watch.
On the flip side, the 50% Fibonacci retracement near 160.50 could act as immediate resistance before the 160.80 key hurdle mentioned previously.
It’s worth noting, however, that the GBP/JPY bulls remain off guard unless the quote stays below the 164.30 resistance confluence, encompassing the 50-DMA and 100-DMA.
Overall, GBP/JPY is likely to decline further even if it manages to cross the nearby resistance.
Trend: Bearish
Technical Levels: Supports and Resistances
GBPJPY currently trading at 159.99 at the time of writing. Pair opened at 160.98 and is trading with a change of -0.61% % .
| Overview | Overview.1 | |
|---|---|---|
| 0 | Today last price | 159.99 |
| 1 | Today Daily Change | -0.99 |
| 2 | Today Daily Change % | -0.61% |
| 3 | Today daily open | 160.98 |
The pair remains strongly bearish on the daily time frame. It trades below the 20 SMA @ 160.84, 50 SMA 164.37, 100 SMA @ 164.27 and 200 SMA @ 163.7.
| Trends | Trends.1 | |
|---|---|---|
| 0 | Daily SMA20 | 160.84 |
| 1 | Daily SMA50 | 164.37 |
| 2 | Daily SMA100 | 164.27 |
| 3 | Daily SMA200 | 163.70 |
The previous day high was 161.22 while the previous day low was 160.51. The daily 38.2% Fib levels comes at 160.95, expected to provide resistance. Similarly, the daily 61.8% fib level is at 160.78, expected to provide resistance.
Note the levels of interest below:
- Pivot support is noted at 160.59, 160.2, 159.88
- Pivot resistance is noted at 161.3, 161.61, 162.0
| Levels | Levels.1 |
|---|---|
| Previous Daily High | 161.22 |
| Previous Daily Low | 160.51 |
| Previous Weekly High | 160.18 |
| Previous Weekly Low | 155.36 |
| Previous Monthly High | 169.28 |
| Previous Monthly Low | 157.84 |
| Daily Fibonacci 38.2% | 160.95 |
| Daily Fibonacci 61.8% | 160.78 |
| Daily Pivot Point S1 | 160.59 |
| Daily Pivot Point S2 | 160.20 |
| Daily Pivot Point S3 | 159.88 |
| Daily Pivot Point R1 | 161.30 |
| Daily Pivot Point R2 | 161.61 |
| Daily Pivot Point R3 | 162.00 |
[/s2If]
Join Our Telegram Group


