#GBPUSD @ 1.21646 grinds near intraday high, snaps two-day losing streak., @nehcap view: Further upside expected (Pivot Orderbook analysis)
…
This is a premium post.
[s2If !current_user_can(access_s2member_level4)]Please register for PREMIUM VERSION HERE to read full post below containing analysis. In case of any error or you think you are not able to read the full post below, please email us at support#nehcap.com [lwa][/s2If] [s2If current_user_can(access_s2member_level4)]
- GBP/USD grinds near intraday high, snaps two-day losing streak.
- Bullish candlestick formation, sustained bounce off key moving average favor buyers.
- Sellers remain off the table unless witnessing fresh monthly low.
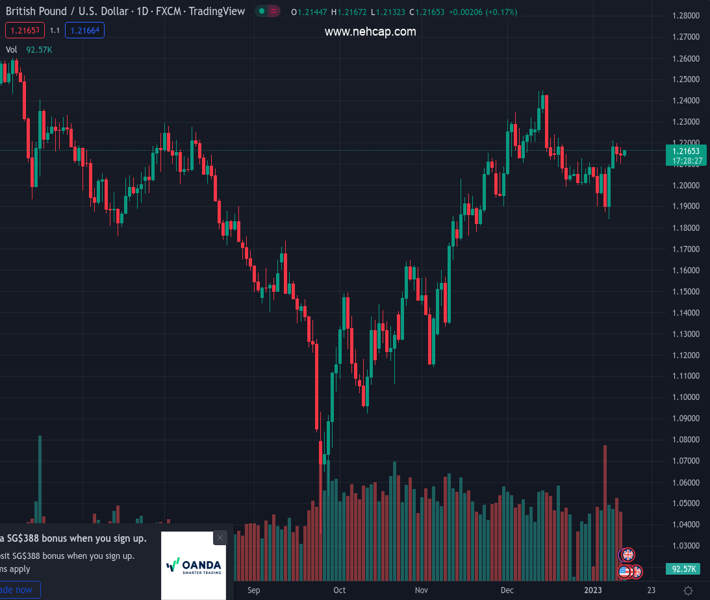
The pair currently trades last at 1.21646.
The previous day high was 1.2179 while the previous day low was 1.21. The daily 38.2% Fib levels comes at 1.213, expected to provide support. Similarly, the daily 61.8% fib level is at 1.2149, expected to provide support.
GBP/USD justifies the previous day’s bullish candlestick formation above the 200-day Exponential Moving Average (EMA) as it prints the first daily gains in three. That said, the Cable pair portrays mild gains near 1.2165 heading into Thursday’s London open.
That said, the quote bounced off the 200-day EMA on Wednesday and marked a Doji candlestick to signal a reversal of the previous downside. Adding strength to the upside bias was the impending bull cross on the MACD indicator.
As a result, the GBP/USD buyers are well-set to poke the 1.2200 threshold comprising a three-week-old descending resistance line.
It’s worth noting, however, that the Cable pair’s strength past 1.2200 will need validation from the monthly high and the December 19, 2022 peak, respectively around 1.2210 and 1.2245, could act as the last defences of the bears before challenging the previous monthly peak of 1.2446.
Meanwhile, GBP/USD sellers may refrain from taking any positions unless the quote stays beyond the 200-day EMA level of 1.2110.
Following that, the 1.2000 psychological magnet and the monthly low of 1.1841 could entertain the bears.
In a case where the GBP/USD prices remain weak past 1.1841, the odds of witnessing a slump towards the late October swing high near 1.1645 can’t be ruled out.
Trend: Further upside expected
Technical Levels: Supports and Resistances
GBPUSD currently trading at 1.2165 at the time of writing. Pair opened at 1.2146 and is trading with a change of 0.16% % .
| Overview | Overview.1 | |
|---|---|---|
| 0 | Today last price | 1.2165 |
| 1 | Today Daily Change | 0.0019 |
| 2 | Today Daily Change % | 0.16% |
| 3 | Today daily open | 1.2146 |
The pair remains strongly bullish on the daily timeframe. It trades above its 20 SMA @ 1.2082, 50 SMA 1.1999, 100 SMA @ 1.168 and 200 SMA @ 1.2005.
| Trends | Trends.1 | |
|---|---|---|
| 0 | Daily SMA20 | 1.2082 |
| 1 | Daily SMA50 | 1.1999 |
| 2 | Daily SMA100 | 1.1680 |
| 3 | Daily SMA200 | 1.2005 |
The previous day high was 1.2179 while the previous day low was 1.21. The daily 38.2% Fib levels comes at 1.213, expected to provide support. Similarly, the daily 61.8% fib level is at 1.2149, expected to provide support.
Note the levels of interest below:
- Pivot support is noted at 1.2105, 1.2064, 1.2027
- Pivot resistance is noted at 1.2183, 1.222, 1.2261
| Levels | Levels.1 |
|---|---|
| Previous Daily High | 1.2179 |
| Previous Daily Low | 1.2100 |
| Previous Weekly High | 1.2102 |
| Previous Weekly Low | 1.1841 |
| Previous Monthly High | 1.2447 |
| Previous Monthly Low | 1.1992 |
| Daily Fibonacci 38.2% | 1.2130 |
| Daily Fibonacci 61.8% | 1.2149 |
| Daily Pivot Point S1 | 1.2105 |
| Daily Pivot Point S2 | 1.2064 |
| Daily Pivot Point S3 | 1.2027 |
| Daily Pivot Point R1 | 1.2183 |
| Daily Pivot Point R2 | 1.2220 |
| Daily Pivot Point R3 | 1.2261 |
[/s2If]
Join Our Telegram Group


