#EURGBP @ 0.88517 is facing barricades while crossing the 0.8878-0.8882 hurdle. (Pivot Orderbook analysis)
…
This is a premium post.
[s2If !current_user_can(access_s2member_level4)]Please register for PREMIUM VERSION HERE to read full post below containing analysis. In case of any error or you think you are not able to read the full post below, please email us at support#nehcap.com [lwa][/s2If] [s2If current_user_can(access_s2member_level4)]
- EUR/GBP is facing barricades while crossing the 0.8878-0.8882 hurdle.
- The 20-EMA at 0.8853 is providing support to the Euro bulls.
- A slippage of the RSI (14) into the 40.00-60.00 range indicates a loss in the upside momentum.
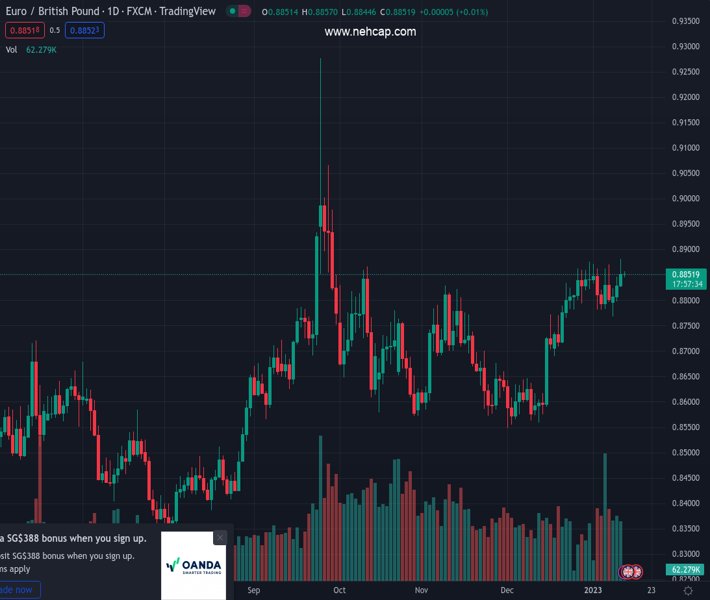
The pair currently trades last at 0.88517.
The previous day high was 0.8882 while the previous day low was 0.8828. The daily 38.2% Fib levels comes at 0.8861, expected to provide resistance. Similarly, the daily 61.8% fib level is at 0.8849, expected to provide support.
The EUR/GBP pair is displaying back-and-forth moves around 0.8850 in the Asian session. The asset corrected after printing a fresh three-month high at 0.8885 on Wednesday. For the past eight trading sessions, the cross is struggling to extend upside above the critical resistance of 0.8880 comfortably.
The cross is expected to display a power-pack action after the release of the United Kingdom manufacturing activities data that comprises Manufacturing Production, Industrial Production, and Gross Domestic Product (GDP) data, which is scheduled for Friday.
On an hourly scale, EUR/GBP has sensed barricades while attempting to cross the supply zone placed in a narrow range of 0.8878-0.8882. After a corrective move, the 20-period Exponential Moving Average (EMA) at 0.8853 is providing support to the Euro bulls. Upward-sloping 50-EMA at 0.8844 adds to the upside filters.
The Relative Strength Index (RSI) (14) has slipped into the 40.00-60.00 range after failing to sustain into the bullish range of 60.00-80.00, which indicates a loss in the upside momentum.
For a fresh upside, the cross needs to overstep a three-month high at 0.8885, which will drive the asset towards September 29 high at 0.8979, followed by the psychological resistance at 0.9000.
On the flip side, a slippage below January 9 low at 0.8767 will drag the asset toward November 18 high at 0.8739. A downside move below the latter will further push the cross lower to December 19 low at 0.8690.
Technical Levels: Supports and Resistances
EURGBP currently trading at 0.8853 at the time of writing. Pair opened at 0.8854 and is trading with a change of -0.01 % .
| Overview | Overview.1 | |
|---|---|---|
| 0 | Today last price | 0.8853 |
| 1 | Today Daily Change | -0.0001 |
| 2 | Today Daily Change % | -0.0100 |
| 3 | Today daily open | 0.8854 |
The pair remains strongly bullish on the daily timeframe. It trades above its 20 SMA @ 0.8803, 50 SMA 0.872, 100 SMA @ 0.8711 and 200 SMA @ 0.8593.
| Trends | Trends.1 | |
|---|---|---|
| 0 | Daily SMA20 | 0.8803 |
| 1 | Daily SMA50 | 0.8720 |
| 2 | Daily SMA100 | 0.8711 |
| 3 | Daily SMA200 | 0.8593 |
The previous day high was 0.8882 while the previous day low was 0.8828. The daily 38.2% Fib levels comes at 0.8861, expected to provide resistance. Similarly, the daily 61.8% fib level is at 0.8849, expected to provide support.
Note the levels of interest below:
- Pivot support is noted at 0.8827, 0.8801, 0.8774
- Pivot resistance is noted at 0.8881, 0.8908, 0.8934
| Levels | Levels.1 |
|---|---|
| Previous Daily High | 0.8882 |
| Previous Daily Low | 0.8828 |
| Previous Weekly High | 0.8875 |
| Previous Weekly Low | 0.8783 |
| Previous Monthly High | 0.8877 |
| Previous Monthly Low | 0.8547 |
| Daily Fibonacci 38.2% | 0.8861 |
| Daily Fibonacci 61.8% | 0.8849 |
| Daily Pivot Point S1 | 0.8827 |
| Daily Pivot Point S2 | 0.8801 |
| Daily Pivot Point S3 | 0.8774 |
| Daily Pivot Point R1 | 0.8881 |
| Daily Pivot Point R2 | 0.8908 |
| Daily Pivot Point R3 | 0.8934 |
[/s2If]
Join Our Telegram Group


