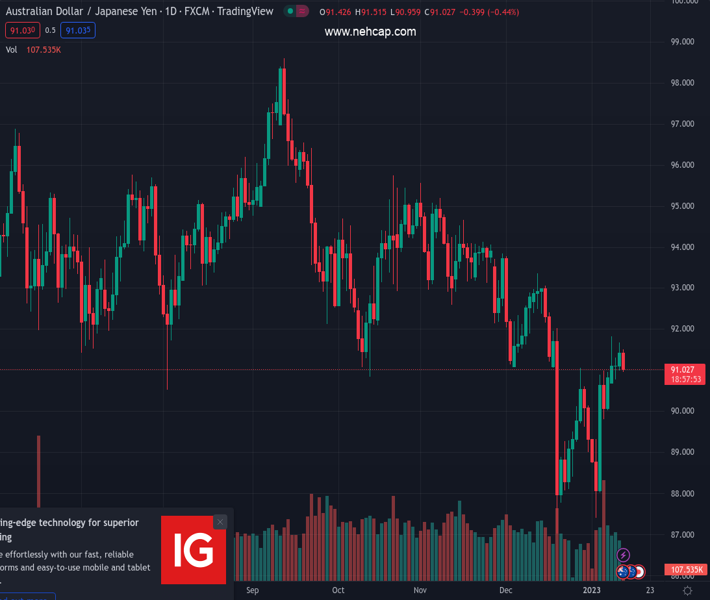
#AUDJPY @ 91.0350 snaps four-day winning streak, stays pressured around intraday low of late., @nehcap view: Further downside expected (Pivot Orderbook analysis)
…
This is a premium post.
[s2If !current_user_can(access_s2member_level4)]Please register for PREMIUM VERSION HERE to read full post below containing analysis. In case of any error or you think you are not able to read the full post below, please email us at support#nehcap.com [lwa][/s2If] [s2If current_user_can(access_s2member_level4)]
- AUD/JPY snaps four-day winning streak, stays pressured around intraday low of late.
- Descending trend line from September 2022 challenges buyers.
- Impending bearish moving average crossover keeps sellers hopeful despite bullish MACD signals.
The pair currently trades last at 91.0350.
The previous day high was 91.67 while the previous day low was 90.95. The daily 38.2% Fib levels comes at 91.4, expected to provide resistance. Similarly, the daily 61.8% fib level is at 91.22, expected to provide resistance.
AUD/JPY takes a U-turn from the short-term key resistance line while snapping four-day uptrend during early Thursday, down 0.45% intraday near 91.10 by the press time. In doing so, the cross-currency pair also teases a bearish moving average crossover on the daily chart.
That said, the 100-DMA knocks the 200-DMA from above and suggests the AUD/JPY pair’s further downside. However, a daily closing of the 100-DMA beneath the 200-DMA becomes necessary to confirm the bearish signal.
Following that, October 2022 low near 90.85 and the 90.00 round figure could lure the pair sellers.
However, a three-week-old ascending support line near 87.70 and the previous monthly low near the 87.00 round figure could challenge the bears afterward.
Meanwhile, recovery moves must provide a daily close beyond the descending resistance line from September, close to 91.60, to convince AUD/JPY buyers.
Even so, a convergence of the aforementioned key moving averages, around 93.20-30 by the press time, appears a tough nut to crack for the bulls.
In a case where AUD/JPY remains firmer past 93.30, the odds of witnessing a run-up towards the October 2022 peak surrounding 95.75 can’t be ruled out.
Overall, AUD/JPY is likely to witness further downside unless the quote crosses the 91.60 hurdle.
Trend: Further downside expected
Technical Levels: Supports and Resistances
AUDJPY currently trading at 91.13 at the time of writing. Pair opened at 91.53 and is trading with a change of -0.44% % .
| Overview | Overview.1 | |
|---|---|---|
| 0 | Today last price | 91.13 |
| 1 | Today Daily Change | -0.40 |
| 2 | Today Daily Change % | -0.44% |
| 3 | Today daily open | 91.53 |
The pair is trading above its 20 Daily moving average @ 90.07, below its 50 Daily moving average @ 92.0 , below its 100 Daily moving average @ 93.33 and below its 200 Daily moving average @ 93.22
| Trends | Trends.1 | |
|---|---|---|
| 0 | Daily SMA20 | 90.07 |
| 1 | Daily SMA50 | 92.00 |
| 2 | Daily SMA100 | 93.33 |
| 3 | Daily SMA200 | 93.22 |
The previous day high was 91.67 while the previous day low was 90.95. The daily 38.2% Fib levels comes at 91.4, expected to provide resistance. Similarly, the daily 61.8% fib level is at 91.22, expected to provide resistance.
Note the levels of interest below:
- Pivot support is noted at 91.1, 90.66, 90.37
- Pivot resistance is noted at 91.82, 92.11, 92.54
| Levels | Levels.1 |
|---|---|
| Previous Daily High | 91.67 |
| Previous Daily Low | 90.95 |
| Previous Weekly High | 90.99 |
| Previous Weekly Low | 87.41 |
| Previous Monthly High | 93.81 |
| Previous Monthly Low | 87.02 |
| Daily Fibonacci 38.2% | 91.40 |
| Daily Fibonacci 61.8% | 91.22 |
| Daily Pivot Point S1 | 91.10 |
| Daily Pivot Point S2 | 90.66 |
| Daily Pivot Point S3 | 90.37 |
| Daily Pivot Point R1 | 91.82 |
| Daily Pivot Point R2 | 92.11 |
| Daily Pivot Point R3 | 92.54 |
[/s2If]
Join Our Telegram Group


