#NZDUSD @ 0.63701 struggles for clear directions after two-day downtrend. (Pivot Orderbook analysis)
…
This is a premium post.
[s2If !current_user_can(access_s2member_level4)]Please register for PREMIUM VERSION HERE to read full post below containing analysis. In case of any error or you think you are not able to read the full post below, please email us at support#nehcap.com [lwa][/s2If] [s2If current_user_can(access_s2member_level4)]
- NZD/USD struggles for clear directions after two-day downtrend.
- China CPI matches upbeat expectations, PPI drops below forecasts in December.
- New Zealand Building Permits rallied in November and favored bulls ahead of key data.
- Hopes of softer US inflation rekindle policy pivot talks but Fed hawks resist stepping back.
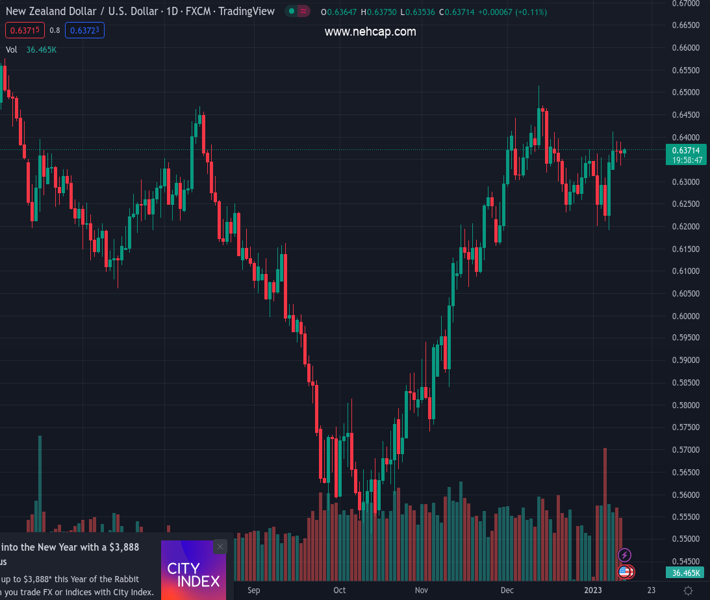
The pair currently trades last at 0.63701.
The previous day high was 0.6401 while the previous day low was 0.6335. The daily 38.2% Fib levels comes at 0.636, expected to provide support. Similarly, the daily 61.8% fib level is at 0.6376, expected to provide resistance.
NZD/USD dribbles around 0.6360-70 as bulls and bears jostle ahead of the key US inflation data. Adding strength to the Kiwi pair traders’ indecision are the recent mixed signs from China’s Consumer Price Index (CPI) and Producer Price Index (PPI) data for December, flashed early Thursday.
China’s headline CPI YoY grew 1.8% YoY versus 1.8% expected and 1.6% prior whereas the Producer Price Index (PPI) marked -0.7% figures compared to -1.3% previous readings and -0.1% market forecasts. Earlier in the day, New Zealand’s Building Permits for November rallied 7% MoM versus -0.1% market forecasts and -10.7% prior slump.
It’s worth noting that the Fed policymakers’ hesitance in praising the market’s dovish bias contrasts with the cautious mood ahead of the key US inflation data to challenge the NZD/USD traders. However, China-linked optimism and upbeat housing figures at home put a floor under the prices.
Federal Reserve Bank of Boston President Susan Collins backed the smaller rate increases while stating that she leans at this stage to a 25 bps hike. The policy, however, also mentioned that it is very data-dependent. Alternatively, China’s total reopening and early signals of heavy holiday shopping join the chatters that the People’s Bank of China (PBOC) will adhere to rate cuts in 2023 to spread the Beijing-inspired optimism.
Against this backdrop, US equities were on the front foot and yields were down while the S&P 500 Futures and the US 10-year Treasury bond yields remain indecision by the press time.
Given the market’s indecision ahead of the US CPI data, the NZD/USD traders may witness further lackluster moves before the inflation release. That said, expectations of softer US inflation keep traders on the edge as the US data has a history of disappointing market forecasts, especially when they’re too important.
Also read: US December CPI Preview: EUR/USD and USD/JPY are pairs to watch
NZD/USD buyers remain hopeful as the pair defends Friday’s upside break of the one-month-old descending resistance line, now support, as well as the 200-SMA, respectively around 0.6295 and 0.6335. However, a convergence of the weekly descending trend line joins the 61.8% Fibonacci retracement level of the pair’s December-January downturn, around 0.6390, appears a tough nut to crack for the bulls.
Technical Levels: Supports and Resistances
NZDUSD currently trading at 0.6367 at the time of writing. Pair opened at 0.6366 and is trading with a change of 0.02% % .
| Overview | Overview.1 | |
|---|---|---|
| 0 | Today last price | 0.6367 |
| 1 | Today Daily Change | 0.0001 |
| 2 | Today Daily Change % | 0.02% |
| 3 | Today daily open | 0.6366 |
The pair remains strongly bullish on the daily timeframe. It trades above its 20 SMA @ 0.632, 50 SMA 0.6246, 100 SMA @ 0.6045 and 200 SMA @ 0.6216.
| Trends | Trends.1 | |
|---|---|---|
| 0 | Daily SMA20 | 0.6320 |
| 1 | Daily SMA50 | 0.6246 |
| 2 | Daily SMA100 | 0.6045 |
| 3 | Daily SMA200 | 0.6216 |
The previous day high was 0.6401 while the previous day low was 0.6335. The daily 38.2% Fib levels comes at 0.636, expected to provide support. Similarly, the daily 61.8% fib level is at 0.6376, expected to provide resistance.
Note the levels of interest below:
- Pivot support is noted at 0.6333, 0.6301, 0.6267
- Pivot resistance is noted at 0.64, 0.6433, 0.6466
| Levels | Levels.1 |
|---|---|
| Previous Daily High | 0.6401 |
| Previous Daily Low | 0.6335 |
| Previous Weekly High | 0.6363 |
| Previous Weekly Low | 0.6190 |
| Previous Monthly High | 0.6514 |
| Previous Monthly Low | 0.6230 |
| Daily Fibonacci 38.2% | 0.6360 |
| Daily Fibonacci 61.8% | 0.6376 |
| Daily Pivot Point S1 | 0.6333 |
| Daily Pivot Point S2 | 0.6301 |
| Daily Pivot Point S3 | 0.6267 |
| Daily Pivot Point R1 | 0.6400 |
| Daily Pivot Point R2 | 0.6433 |
| Daily Pivot Point R3 | 0.6466 |
[/s2If]
Join Our Telegram Group


