#AUDUSD @ 0.69181 grinds higher even as China CPI improved but PPI eased for December., @nehcap view: Further upside expected (Pivot Orderbook analysis)
…
This is a premium post.
[s2If !current_user_can(access_s2member_level4)]Please register for PREMIUM VERSION HERE to read full post below containing analysis. In case of any error or you think you are not able to read the full post below, please email us at support#nehcap.com [lwa][/s2If] [s2If current_user_can(access_s2member_level4)]
- AUD/USD grinds higher even as China CPI improved but PPI eased for December.
- Successful trading above 200-DMA, previous resistance line from June favor bulls.
- Two-month-old ascending trend line lures buyers amid bullish MACD signals.
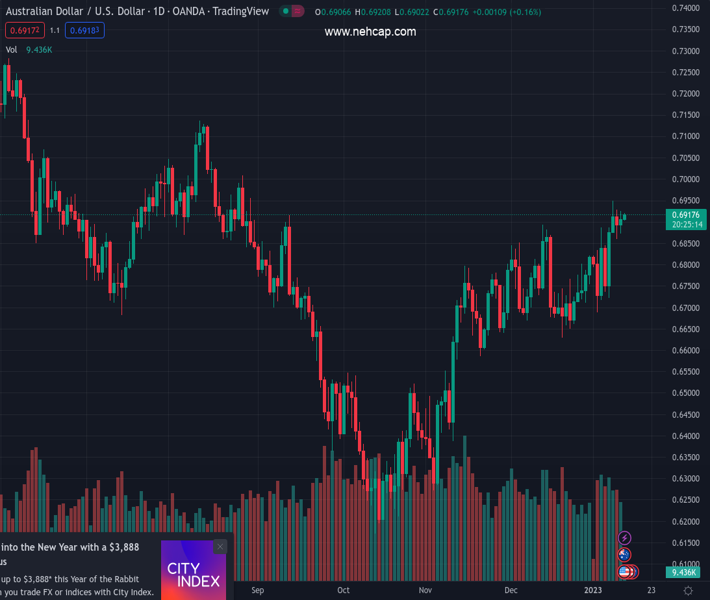
The pair currently trades last at 0.69181.
The previous day high was 0.6926 while the previous day low was 0.6873. The daily 38.2% Fib levels comes at 0.6906, expected to provide support. Similarly, the daily 61.8% fib level is at 0.6893, expected to provide support.
AUD/USD seesaws around the intraday high near 0.6925 even as China prints mixed inflation data for December during early Thursday. In doing so, the Aussie pair extends the previous day’s gains while staying firmer around the highest levels since late August 2022, marked earlier in the week.
That said, China’s headline Consumer Price Index (CPI) YoY grew 1.8% YoY versus 1.8% expected and 1.6% prior whereas the Producer Price Index (PPI) marked -0.7% figures compared to -1.3% previous readings and -0.1% market forecasts.
In addition to the mostly firmer data from Australia’s biggest customer China, the AUD/USD pair’s ability to defend the previous week’s upside break of the 200-DMA and a downward-sloping trend line from June, respectively around 0.6830 and 0.6815, also favor the bulls.
Additionally, keeping the AUD/USD pair on the buyer’s radar are the bullish MACD signals.
As a result, the Aussie pair is well-set to poke a two-month-old ascending resistance line, around 0.6960 at the latest. However, the late August 2022 top surrounding the 0.7000 psychological magnet could challenge the AUD/USD bulls afterward.
Alternatively, AUD/USD downside remains elusive beyond the 0.6815 level comprising the previous resistance line.
Following that, the monthly low of 0.6687 and June 2022 bottom close to 0.6680 could lure the AUD/USD bears before the previous monthly trough surrounding 0.6630.
Trend: Further upside expected
Technical Levels: Supports and Resistances
AUDUSD currently trading at 0.6914 at the time of writing. Pair opened at 0.6907 and is trading with a change of 0.10% % .
| Overview | Overview.1 | |
|---|---|---|
| 0 | Today last price | 0.6914 |
| 1 | Today Daily Change | 0.0007 |
| 2 | Today Daily Change % | 0.10% |
| 3 | Today daily open | 0.6907 |
The pair remains strongly bullish on the daily timeframe. It trades above its 20 SMA @ 0.6767, 50 SMA 0.6715, 100 SMA @ 0.6635 and 200 SMA @ 0.6836.
| Trends | Trends.1 | |
|---|---|---|
| 0 | Daily SMA20 | 0.6767 |
| 1 | Daily SMA50 | 0.6715 |
| 2 | Daily SMA100 | 0.6635 |
| 3 | Daily SMA200 | 0.6836 |
The previous day high was 0.6926 while the previous day low was 0.6873. The daily 38.2% Fib levels comes at 0.6906, expected to provide support. Similarly, the daily 61.8% fib level is at 0.6893, expected to provide support.
Note the levels of interest below:
- Pivot support is noted at 0.6878, 0.6849, 0.6825
- Pivot resistance is noted at 0.6931, 0.6954, 0.6983
| Levels | Levels.1 |
|---|---|
| Previous Daily High | 0.6926 |
| Previous Daily Low | 0.6873 |
| Previous Weekly High | 0.6887 |
| Previous Weekly Low | 0.6688 |
| Previous Monthly High | 0.6893 |
| Previous Monthly Low | 0.6629 |
| Daily Fibonacci 38.2% | 0.6906 |
| Daily Fibonacci 61.8% | 0.6893 |
| Daily Pivot Point S1 | 0.6878 |
| Daily Pivot Point S2 | 0.6849 |
| Daily Pivot Point S3 | 0.6825 |
| Daily Pivot Point R1 | 0.6931 |
| Daily Pivot Point R2 | 0.6954 |
| Daily Pivot Point R3 | 0.6983 |
[/s2If]
Join Our Telegram Group


