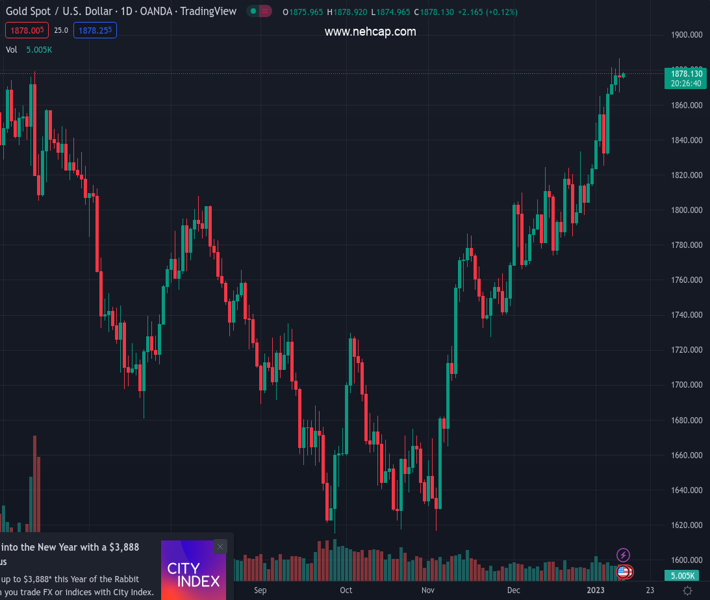
#XAUUSD @ 1,877.95 Gold price is marching towards $1,880.00 as the US Dollar Index is struggling to find support. (Pivot Orderbook analysis)
…
This is a premium post.
[s2If !current_user_can(access_s2member_level4)]Please register for PREMIUM VERSION HERE to read full post below containing analysis. In case of any error or you think you are not able to read the full post below, please email us at support#nehcap.com [lwa][/s2If] [s2If current_user_can(access_s2member_level4)]
- Gold price is marching towards $1,880.00 as the US Dollar Index is struggling to find support.
- The 10-year US Treasury yields have weighed down to 3.55% amid an upbeat market mood.
- The headline US CPI is seen declining to 6.7% led by lower gasoline prices.
The pair currently trades last at 1877.95.
The previous day high was 1886.67 while the previous day low was 1867.13. The daily 38.2% Fib levels comes at 1874.59, expected to provide support. Similarly, the daily 61.8% fib level is at 1879.21, expected to provide resistance.
Gold price (XAU/USD) is aiming to extend its recovery to near the critical resistance at $1,880.00 in the Asian session. The precious metal recovered sharply in the late New York session after dropping to near $1,867.50 amid its rangebound behavior ahead of the release of the United States inflation data.
S&P500 futures are displaying a subdued performance in Asia, however, the overall risk profile is significantly positive. The alpha generated by 10-year US Treasury bonds has surrendered its recovery move amid optimism, on a broader note, and has slipped to near 3.55%. Meanwhile, the US Dollar Index (DXY) has slipped further to near 102.75 as the street is expecting a further slowdown in the Consumer Price Index (CPI).
Analysts at NBF, see headline prices decreasing 0.1% MoM and the year-on-year rate should come down from 7.1% to 6.7%. The food component likely remained relatively strong, but this increase should have been more than compensated by lower gasoline prices. The Core index, meanwhile, may have continued to be supported by rising rent prices and advanced 0.3% on a monthly basis. This would translate into a two-tick decline of the 12-month rate to 5.8%.”
From a risk-on mood to an economic slowdown and lower consensus for the United States Consumer Price Index (CPI), none of the catalysts is showing signs of recovery in the US Dollar Index after the carnage. A decline in the US inflation figures might force the Federal Reserve (Fed) to revise its monetary policy projections for CY2023 and beyond.
Gold price is struggling to find direction and is oscillating in a $1,868.30-1,885.85 range from the past four trading sessions. The upside bias is still solid as the 50-and 200-period Exponential Moving Averages (EMAs) at $1,875.41 and $1,854.89 respectively are sloping north, which adds to the upside filters.
Meanwhile, the Relative Strength Index (RSI) (14) is oscillating in a 40.00-60.00 range, which indicates a consolidation ahead.
Technical Levels: Supports and Resistances
XAUUSD currently trading at 1877.98 at the time of writing. Pair opened at 1876.52 and is trading with a change of 0.08 % .
| Overview | Overview.1 | |
|---|---|---|
| 0 | Today last price | 1877.98 |
| 1 | Today Daily Change | 1.46 |
| 2 | Today Daily Change % | 0.08 |
| 3 | Today daily open | 1876.52 |
The pair remains strongly bullish on the daily timeframe. It trades above its 20 SMA @ 1823.72, 50 SMA 1782.87, 100 SMA @ 1730.86 and 200 SMA @ 1777.31.
| Trends | Trends.1 | |
|---|---|---|
| 0 | Daily SMA20 | 1823.72 |
| 1 | Daily SMA50 | 1782.87 |
| 2 | Daily SMA100 | 1730.86 |
| 3 | Daily SMA200 | 1777.31 |
The previous day high was 1886.67 while the previous day low was 1867.13. The daily 38.2% Fib levels comes at 1874.59, expected to provide support. Similarly, the daily 61.8% fib level is at 1879.21, expected to provide resistance.
Note the levels of interest below:
- Pivot support is noted at 1866.88, 1857.23, 1847.34
- Pivot resistance is noted at 1886.42, 1896.31, 1905.96
| Levels | Levels.1 |
|---|---|
| Previous Daily High | 1886.67 |
| Previous Daily Low | 1867.13 |
| Previous Weekly High | 1869.91 |
| Previous Weekly Low | 1823.76 |
| Previous Monthly High | 1833.38 |
| Previous Monthly Low | 1765.89 |
| Daily Fibonacci 38.2% | 1874.59 |
| Daily Fibonacci 61.8% | 1879.21 |
| Daily Pivot Point S1 | 1866.88 |
| Daily Pivot Point S2 | 1857.23 |
| Daily Pivot Point S3 | 1847.34 |
| Daily Pivot Point R1 | 1886.42 |
| Daily Pivot Point R2 | 1896.31 |
| Daily Pivot Point R3 | 1905.96 |
[/s2If]
Join Our Telegram Group


