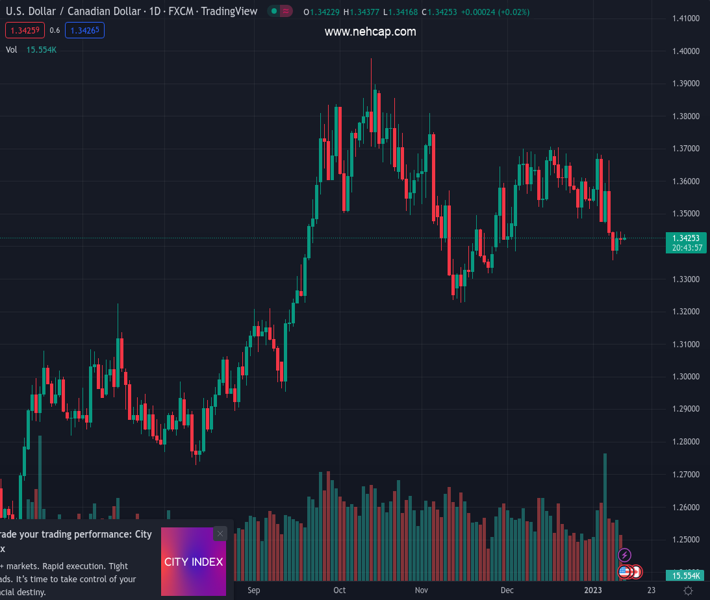
#USDCAD @ 1.34260 lacks clear directions amid softer US Dollar, lackluster Oil price. (Pivot Orderbook analysis)
…
This is a premium post.
[s2If !current_user_can(access_s2member_level4)]Please register for PREMIUM VERSION HERE to read full post below containing analysis. In case of any error or you think you are not able to read the full post below, please email us at support#nehcap.com [lwa][/s2If] [s2If current_user_can(access_s2member_level4)]
- USD/CAD lacks clear directions amid softer US Dollar, lackluster Oil price.
- Mixed sentiment, cautious mood ahead of US CPI restrict Loonie pair’s moves.
- Upbeat US inflation data appears necessary to defend bulls.
The pair currently trades last at 1.34260.
The previous day high was 1.3445 while the previous day low was 1.3404. The daily 38.2% Fib levels comes at 1.343, expected to provide resistance. Similarly, the daily 61.8% fib level is at 1.342, expected to provide support.
USD/CAD clings to 1.3430 while keeping the previous day’s inaction as markets turn cautious ahead of the key US Consumer Price Index (CPI) data for December. In doing so, the Loonie pair struggles to cheer the downbeat US Dollar Index (DXY) as prices of Canada’s main export item, WTI crude oil, fail to extend the latest run-up.
That said, the DXY holds lower grounds near 103.10-15 while portraying the failures to bounce off a seven-month low marked earlier in the week. The US Dollar Index weakness could be linked to the recently downbeat comments from the Federal Reserve (Fed) officials, as well as risk-positive headlines from China.
On Wednesday, Federal Reserve’s Boston President Susan Collins backed the smaller rate increases while stating that she leans at this stage to a 25 bps hike. The policy, however, also mentioned that it is very data-dependent. Furthermore, China’s total reopening and early signals of heavy holiday shopping join the chatters that the People’s Bank of China (PBOC) will adhere to rate cuts in 2023 to spread the Beijing-inspired optimism.
It should be noted that WTI crude oil remains indecisive around $78.00 after rising the most in two months the previous day. The black gold cheered broad US Dollar weakness, hopes of more energy demand from China. It’s worth noting that a heavy increase in the oil inventories, as signaled by the US Energy Information Administration (EIA) data, failed to weigh on the black gold. “The US Energy Information Administration (EIA) said crude inventories jumped by 19.0 million barrels last week, the third biggest weekly gain ever and the most since stocks rose by a record 21.6 million barrels in Feb 2021,” reported Reuters.
Amid these plays, US equities were on the front foot and yields were down while the S&P 500 Futures and the US 10-year Treasury bond yields remain indecision by the press time.
Looking forward, USD/CAD traders should pay attention to the US CPI ex Food & Energy for December, expected 5.7% versus 6.0% prior, for clear directions.
Wednesday’s Doji candlestick joins the USD/CAD pair’s inability to cross the 100-day Exponential Moving Average (EMA), around 1.3430 by the press time, to signal the quote’s further downside.
Technical Levels: Supports and Resistances
USDCAD currently trading at 1.343 at the time of writing. Pair opened at 1.3427 and is trading with a change of 0.02% % .
| Overview | Overview.1 | |
|---|---|---|
| 0 | Today last price | 1.343 |
| 1 | Today Daily Change | 0.0003 |
| 2 | Today Daily Change % | 0.02% |
| 3 | Today daily open | 1.3427 |
The pair is trading below its 20 Daily moving average @ 1.3563, below its 50 Daily moving average @ 1.3507 , below its 100 Daily moving average @ 1.3488 and above its 200 Daily moving average @ 1.3161
| Trends | Trends.1 | |
|---|---|---|
| 0 | Daily SMA20 | 1.3563 |
| 1 | Daily SMA50 | 1.3507 |
| 2 | Daily SMA100 | 1.3488 |
| 3 | Daily SMA200 | 1.3161 |
The previous day high was 1.3445 while the previous day low was 1.3404. The daily 38.2% Fib levels comes at 1.343, expected to provide resistance. Similarly, the daily 61.8% fib level is at 1.342, expected to provide support.
Note the levels of interest below:
- Pivot support is noted at 1.3406, 1.3385, 1.3366
- Pivot resistance is noted at 1.3447, 1.3466, 1.3487
| Levels | Levels.1 |
|---|---|
| Previous Daily High | 1.3445 |
| Previous Daily Low | 1.3404 |
| Previous Weekly High | 1.3685 |
| Previous Weekly Low | 1.3433 |
| Previous Monthly High | 1.3705 |
| Previous Monthly Low | 1.3385 |
| Daily Fibonacci 38.2% | 1.3430 |
| Daily Fibonacci 61.8% | 1.3420 |
| Daily Pivot Point S1 | 1.3406 |
| Daily Pivot Point S2 | 1.3385 |
| Daily Pivot Point S3 | 1.3366 |
| Daily Pivot Point R1 | 1.3447 |
| Daily Pivot Point R2 | 1.3466 |
| Daily Pivot Point R3 | 1.3487 |
[/s2If]
Join Our Telegram Group


