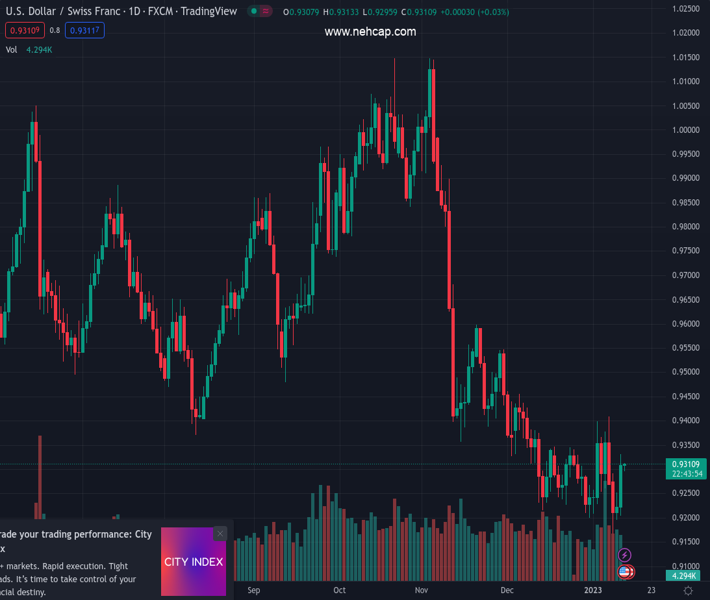
#USDCHF @ 0.93107 has turned sideways after a firmer recovery move from around 0.9200. (Pivot Orderbook analysis)
…
This is a premium post.
[s2If !current_user_can(access_s2member_level4)]Please register for PREMIUM VERSION HERE to read full post below containing analysis. In case of any error or you think you are not able to read the full post below, please email us at support#nehcap.com [lwa][/s2If] [s2If current_user_can(access_s2member_level4)]
- USD/CHF has turned sideways after a firmer recovery move from around 0.9200.
- A follow-up buying after a Double Bottom formation indicates the strength of the US Dollar.
- The RSI (14) has comfortably shifted into the bullish range of 60.00-80.00, which indicates more upside ahead.
The pair currently trades last at 0.93107.
The previous day high was 0.9252 while the previous day low was 0.9195. The daily 38.2% Fib levels comes at 0.923, expected to provide support. Similarly, the daily 61.8% fib level is at 0.9217, expected to provide support.
The USD/CHF pair has picked strength after a minor correction to near 0.9300 in the Asian session. The Swiss franc asset faced barricades near 0.9325 in an attempt to extend its upside journey. On Wednesday, the major displayed a responsive buying action after dropping to near 0.9204.
The major could remain inside the woods ahead of the release of the United States inflation data. Meanwhile, the risk appetite of investors is significantly improved as S&P500 has displayed back-to-back bullish trading sessions despite anxiety ahead of the release of the US Consumer Price Index (CPI) data. The US Dollar Index (DXY) is hovering around 103.00.
On an hourly scale, USD/CHF witnessed a sharp bullish reversal after forming a Double Bottom chart pattern near the round-level support of 0.9200. After sensing weak selling interest near the aforementioned support, bulls made a comeback and pushed the asset higher vigorously.
The 20-and 50-period Exponential Moving Averages (EMAs) at 0.9283 and 0.9260 are upward-sloping now, which adds to the upside filters.
Meanwhile, the Relative Strength Index (RSI) (14) has comfortably shifted into the bullish range of 60.00-80.00 from the 40.00-60.00 range, which indicates that the bullish momentum has been triggered.
Going forward, a break above Wednesday’s high at 0.9332 will drive the asset towards December 12 high at 0.9367 followed by the round-level resistance at 0.9400.
Alternatively, a slippage below Monday’s low at 0.9167 will result in a fresh downside journey toward the March low at 0.9150. A downside move below the March low will expose the asset to January 17 low at 0.9117.
Technical Levels: Supports and Resistances
USDCHF currently trading at 0.9309 at the time of writing. Pair opened at 0.9228 and is trading with a change of 0.88 % .
| Overview | Overview.1 | |
|---|---|---|
| 0 | Today last price | 0.9309 |
| 1 | Today Daily Change | 0.0081 |
| 2 | Today Daily Change % | 0.8800 |
| 3 | Today daily open | 0.9228 |
The pair is trading above its 20 Daily moving average @ 0.9286, below its 50 Daily moving average @ 0.9443 , below its 100 Daily moving average @ 0.9635 and below its 200 Daily moving average @ 0.9644
| Trends | Trends.1 | |
|---|---|---|
| 0 | Daily SMA20 | 0.9286 |
| 1 | Daily SMA50 | 0.9443 |
| 2 | Daily SMA100 | 0.9635 |
| 3 | Daily SMA200 | 0.9644 |
The previous day high was 0.9252 while the previous day low was 0.9195. The daily 38.2% Fib levels comes at 0.923, expected to provide support. Similarly, the daily 61.8% fib level is at 0.9217, expected to provide support.
Note the levels of interest below:
- Pivot support is noted at 0.9198, 0.9168, 0.9141
- Pivot resistance is noted at 0.9255, 0.9282, 0.9312
| Levels | Levels.1 |
|---|---|
| Previous Daily High | 0.9252 |
| Previous Daily Low | 0.9195 |
| Previous Weekly High | 0.9410 |
| Previous Weekly Low | 0.9223 |
| Previous Monthly High | 0.9471 |
| Previous Monthly Low | 0.9201 |
| Daily Fibonacci 38.2% | 0.9230 |
| Daily Fibonacci 61.8% | 0.9217 |
| Daily Pivot Point S1 | 0.9198 |
| Daily Pivot Point S2 | 0.9168 |
| Daily Pivot Point S3 | 0.9141 |
| Daily Pivot Point R1 | 0.9255 |
| Daily Pivot Point R2 | 0.9282 |
| Daily Pivot Point R3 | 0.9312 |
[/s2If]
Join Our Telegram Group


