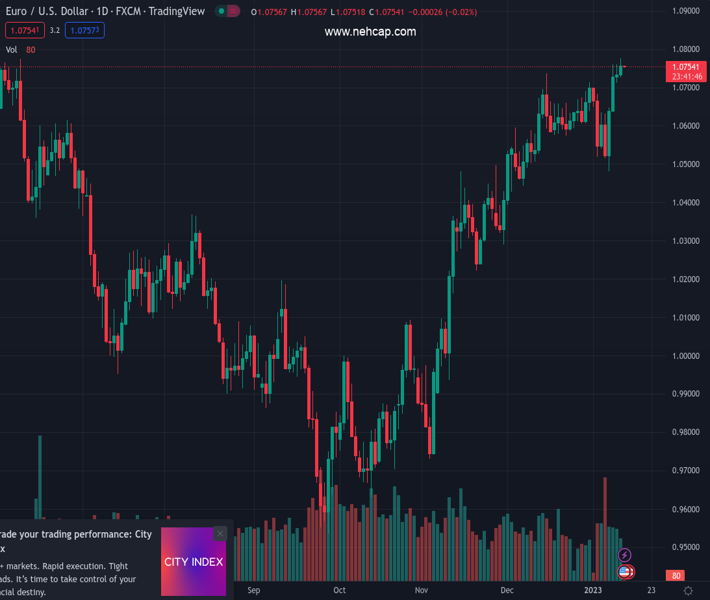
#EURUSD @ 1.07464 is demonstrating volatility contraction as the focus has shifted to the US inflation data. (Pivot Orderbook analysis)
…
This is a premium post.
[s2If !current_user_can(access_s2member_level4)]Please register for PREMIUM VERSION HERE to read full post below containing analysis. In case of any error or you think you are not able to read the full post below, please email us at support#nehcap.com [lwa][/s2If] [s2If current_user_can(access_s2member_level4)]
- EUR/USD is demonstrating volatility contraction as the focus has shifted to the US inflation data.
- A consecutive bullish session reported by S&P500 indicates that the risk profile is extremely solid.
- Improved risk appetite has weighed down the 10-year US Treasury yields to 3.54%.
The pair currently trades last at 1.07464.
The previous day high was 1.0759 while the previous day low was 1.0712. The daily 38.2% Fib levels comes at 1.0741, expected to provide support. Similarly, the daily 61.8% fib level is at 1.073, expected to provide support.
The EUR/USD pair is displaying back-and-forth moves around 1.0750 in the early Tokyo session. The major currency major is showing extreme volatility contraction, which indicates that investors are not ready to build fresh positions before the release of the United States inflation data.
The risk profile seems extremely solid as S&P500 has recorded two consecutive bullish trading sessions. It seems that investors are optimistic on CY2023. Also, the demand for US government bonds remained upbeat, which led to a significant fall in the 10-year US Treasury yields to 3.54%. The US Dollar Index (DXY) continued its sideways profile around 103.00 ahead of the US Consumer Price Index (CPI) data.
This time, the inflation data is getting pivotal for the market participants as wage inflation has shown meaningful signs of deceleration, which Federal Reserve (Fed) policymakers were considering a major threat to the agenda of achieving price stability.
The headline CPI (Dec) is expected to continue its declining spree and may drop to 6.5% from the former figure of 7.1%. While the core CPI that excludes oil and food prices might slip to 5.7% from 6.0% reported earlier. Weaker retail demand, a spree of declining employment additions in the United States economy, a slowdown in economic activities, and now a fall in employment bills have collectively resulted in lower consensus for inflation projections.
On the Eurozone front, after European Central Bank (ECB)’s governing council member Mario Centeno, another ECB member and French central bank governor Francois Villeroy de Galhau said on Wednesday, the central bank should aim to reach the terminal rate by the summer. He further added that ECB needs to be pragmatic about the pace of rate hikes.
Technical Levels: Supports and Resistances
EURUSD currently trading at 1.0758 at the time of writing. Pair opened at 1.0736 and is trading with a change of 0.2 % .
| Overview | Overview.1 | |
|---|---|---|
| 0 | Today last price | 1.0758 |
| 1 | Today Daily Change | 0.0022 |
| 2 | Today Daily Change % | 0.2000 |
| 3 | Today daily open | 1.0736 |
The pair remains strongly bullish on the daily timeframe. It trades above its 20 SMA @ 1.0632, 50 SMA 1.0444, 100 SMA @ 1.0165 and 200 SMA @ 1.0312.
| Trends | Trends.1 | |
|---|---|---|
| 0 | Daily SMA20 | 1.0632 |
| 1 | Daily SMA50 | 1.0444 |
| 2 | Daily SMA100 | 1.0165 |
| 3 | Daily SMA200 | 1.0312 |
The previous day high was 1.0759 while the previous day low was 1.0712. The daily 38.2% Fib levels comes at 1.0741, expected to provide support. Similarly, the daily 61.8% fib level is at 1.073, expected to provide support.
Note the levels of interest below:
- Pivot support is noted at 1.0712, 1.0689, 1.0665
- Pivot resistance is noted at 1.076, 1.0783, 1.0807
| Levels | Levels.1 |
|---|---|
| Previous Daily High | 1.0759 |
| Previous Daily Low | 1.0712 |
| Previous Weekly High | 1.0710 |
| Previous Weekly Low | 1.0483 |
| Previous Monthly High | 1.0736 |
| Previous Monthly Low | 1.0393 |
| Daily Fibonacci 38.2% | 1.0741 |
| Daily Fibonacci 61.8% | 1.0730 |
| Daily Pivot Point S1 | 1.0712 |
| Daily Pivot Point S2 | 1.0689 |
| Daily Pivot Point S3 | 1.0665 |
| Daily Pivot Point R1 | 1.0760 |
| Daily Pivot Point R2 | 1.0783 |
| Daily Pivot Point R3 | 1.0807 |
[/s2If]
Join Our Telegram Group


