#EURUSD @ 1.07608 rallied on a weak US Dollar and ECB hawkish commentary. (Pivot Orderbook analysis)
…
This is a premium post.
[s2If !current_user_can(access_s2member_level4)]Please register for PREMIUM VERSION HERE to read full post below containing analysis. In case of any error or you think you are not able to read the full post below, please email us at support#nehcap.com [lwa][/s2If] [s2If current_user_can(access_s2member_level4)]
- EUR/USD rallied on a weak US Dollar and ECB hawkish commentary.
- Federal Reserve Chair Jerome Powell’s speech on Tuesday did not provide any guidance ahead of the US CPI report.
- EUR/USD Price Analysis: A break/close above 1.0770 would pave the way to test 1.0800
The pair currently trades last at 1.07608.
The previous day high was 1.0759 while the previous day low was 1.0712. The daily 38.2% Fib levels comes at 1.0741, expected to provide support. Similarly, the daily 61.8% fib level is at 1.073, expected to provide support.
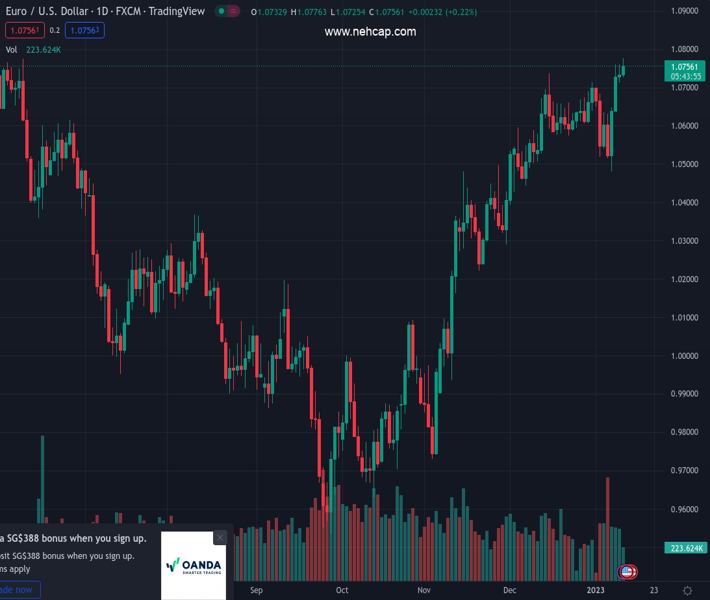
The Euro (EUR) resumed its uptrend vs. the US Dollar (USD) and rose to an eight-month new high around 1.0776, ahead of the release of the Consumer Price Index (CPI) in the United States (US), which is foreseen to slow down. Hence the EUR/USD is trading at 1.0759 after hitting a daily low of 1.0725.
Wall Street continues its rally ahead of the release of the US CPI report. The lack of US economic data releases and an irrelevant speech by the US Federal Reserve (Fed) Chair Jerome Powell on Tuesday left the EUR/USD adrift to speculations that US inflation would ease, which could pave the way for a less aggressive Fed. Consequently, the EUR/USD rose steadily.
Aside from this, the EUR/USD got a lift courtesy of several European Central Bank (ECB) officials’ hawkish commentaries. On Tuesday, ECB’s Schnabel said that “interest rates will still have to rise significantly” and that “inflation will not subside by itself.” On Wednesday, the Bank of France Governor and ECB Governing Council (GC) member Francois Villeroy said that the ECB should reach its terminal rate by the summer.
Later, the Austrian Central Bank Governor Robert Holtzmann added that “rates will have to rise significantly further to reach levels that are sufficiently restrictive to ensure a timely return of inflation to target.” Echoing some of his comments was Olli Rehn, who added that rates need to rise “significantly” in the next couple of meetings and reach restrictive levels to dampen inflation.
Ahead of the week, the US economic docket will feature the Consumer Price Index (CPI) report Thursday, with estimates at 0% MoM while annual based is estimated at 6.5%. The so-called Core CPI is foreseen at 0.3% MoM, a tick higher than the previous month, while yearly, it is estimated to come at 5.7%.
From a daily chart perspective, the EUR/USD break of weekly highs around 1.0750s opened the door for testing the June 2022 highs of 1.0773. Once that price level is broken, the EUR/USD might test the 1.0800 figure in the near term. That scenario is backed by the Relative Strength Index (RSI) being in bullish territory and aiming higher, though the Rate of Change (RoC) suggests that volatility remains unchanged. Therefore, the EUR/USD might continue to advance steadily or consolidate.
On the other hand, EUR/USD failure to crack 1.0800 would expose the pair to selling pressure, which could tumble the pair to 1.0750, followed by a test of the January 10 daily low of 1.0711 and the 1.0700 figure.
Technical Levels: Supports and Resistances
EURUSD currently trading at 1.0755 at the time of writing. Pair opened at 1.0736 and is trading with a change of 0.18 % .
| Overview | Overview.1 | |
|---|---|---|
| 0 | Today last price | 1.0755 |
| 1 | Today Daily Change | 0.0019 |
| 2 | Today Daily Change % | 0.1800 |
| 3 | Today daily open | 1.0736 |
The pair remains strongly bullish on the daily timeframe. It trades above its 20 SMA @ 1.0632, 50 SMA 1.0444, 100 SMA @ 1.0165 and 200 SMA @ 1.0312.
| Trends | Trends.1 | |
|---|---|---|
| 0 | Daily SMA20 | 1.0632 |
| 1 | Daily SMA50 | 1.0444 |
| 2 | Daily SMA100 | 1.0165 |
| 3 | Daily SMA200 | 1.0312 |
The previous day high was 1.0759 while the previous day low was 1.0712. The daily 38.2% Fib levels comes at 1.0741, expected to provide support. Similarly, the daily 61.8% fib level is at 1.073, expected to provide support.
Note the levels of interest below:
- Pivot support is noted at 1.0712, 1.0689, 1.0665
- Pivot resistance is noted at 1.076, 1.0783, 1.0807
| Levels | Levels.1 |
|---|---|
| Previous Daily High | 1.0759 |
| Previous Daily Low | 1.0712 |
| Previous Weekly High | 1.0710 |
| Previous Weekly Low | 1.0483 |
| Previous Monthly High | 1.0736 |
| Previous Monthly Low | 1.0393 |
| Daily Fibonacci 38.2% | 1.0741 |
| Daily Fibonacci 61.8% | 1.0730 |
| Daily Pivot Point S1 | 1.0712 |
| Daily Pivot Point S2 | 1.0689 |
| Daily Pivot Point S3 | 1.0665 |
| Daily Pivot Point R1 | 1.0760 |
| Daily Pivot Point R2 | 1.0783 |
| Daily Pivot Point R3 | 1.0807 |
[/s2If]
Join Our Telegram Group


