#USDCHF @ 0.93098 The Swiss Franc is among the worst performers on Wednesday. (Pivot Orderbook analysis)
…
This is a premium post.
[s2If !current_user_can(access_s2member_level4)]Please register for PREMIUM VERSION HERE to read full post below containing analysis. In case of any error or you think you are not able to read the full post below, please email us at support#nehcap.com [lwa][/s2If] [s2If current_user_can(access_s2member_level4)]
- The Swiss Franc is among the worst performers on Wednesday.
- US Dollar post mixt results during the American session ahead of US CPI.
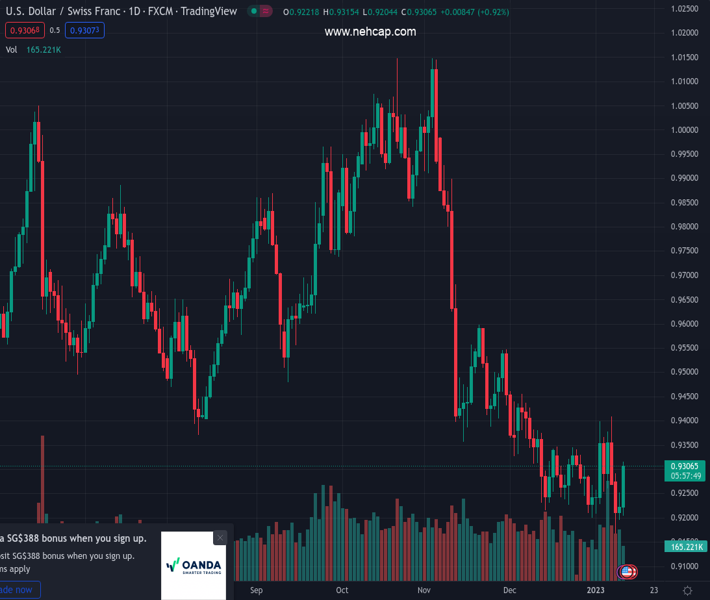
- USD/CHF rebounds sharply, above the 20-day SMA.
The pair currently trades last at 0.93098.
The previous day high was 0.9252 while the previous day low was 0.9195. The daily 38.2% Fib levels comes at 0.923, expected to provide support. Similarly, the daily 61.8% fib level is at 0.9217, expected to provide support.
The USD/CHF is rising by more than 70 pips on Wednesday extending the recovery from the multi-month it reached on Monday at 0.9165. The pair rose momentarily above 0.9300 for the first time since Friday.
Following two days of gains, USD/CHF is back above the 20-day Simple Moving Average (SMA) that stands at 0.9285. The bias is still bearish but the 0.9200 area is becoming a strong support.
The Swiss Franc is the worst performer of the American session. Switzerland bonds are soaring. The Swiss 10-year bond yield is falling by more than 10% at the time of writing, at 1.26%, the lowest level since December 19.
The USD/CHF broke above 0.9250 and accelerated to the upside. It peaked at 0.9303 and then pulled back finding support at 0.9285. At the same time EUR/USD trades at fresh multi-month highs above 1.0770. The EUR/CHF is having the best day in months and it hit levels above parity for the first time since July.
The US Dollar is mixed on Wednesday as market participants await the US CPI report due on Thursday. The index is expected to remain unchanged in December with the annual rate falling from 7.1% to 6.5%.
Technical Levels: Supports and Resistances
USDCHF currently trading at 0.9287 at the time of writing. Pair opened at 0.9228 and is trading with a change of 0.64 % .
| Overview | Overview.1 | |
|---|---|---|
| 0 | Today last price | 0.9287 |
| 1 | Today Daily Change | 0.0059 |
| 2 | Today Daily Change % | 0.6400 |
| 3 | Today daily open | 0.9228 |
The pair is trading above its 20 Daily moving average @ 0.9286, below its 50 Daily moving average @ 0.9443 , below its 100 Daily moving average @ 0.9635 and below its 200 Daily moving average @ 0.9644
| Trends | Trends.1 | |
|---|---|---|
| 0 | Daily SMA20 | 0.9286 |
| 1 | Daily SMA50 | 0.9443 |
| 2 | Daily SMA100 | 0.9635 |
| 3 | Daily SMA200 | 0.9644 |
The previous day high was 0.9252 while the previous day low was 0.9195. The daily 38.2% Fib levels comes at 0.923, expected to provide support. Similarly, the daily 61.8% fib level is at 0.9217, expected to provide support.
Note the levels of interest below:
- Pivot support is noted at 0.9198, 0.9168, 0.9141
- Pivot resistance is noted at 0.9255, 0.9282, 0.9312
| Levels | Levels.1 |
|---|---|
| Previous Daily High | 0.9252 |
| Previous Daily Low | 0.9195 |
| Previous Weekly High | 0.9410 |
| Previous Weekly Low | 0.9223 |
| Previous Monthly High | 0.9471 |
| Previous Monthly Low | 0.9201 |
| Daily Fibonacci 38.2% | 0.9230 |
| Daily Fibonacci 61.8% | 0.9217 |
| Daily Pivot Point S1 | 0.9198 |
| Daily Pivot Point S2 | 0.9168 |
| Daily Pivot Point S3 | 0.9141 |
| Daily Pivot Point R1 | 0.9255 |
| Daily Pivot Point R2 | 0.9282 |
| Daily Pivot Point R3 | 0.9312 |
[/s2If]
Join Our Telegram Group


