#AUDUSD @ 0.69011 regains positive traction in reaction to the upbeat Australian macro data. (Pivot Orderbook analysis)
…
This is a premium post.
[s2If !current_user_can(access_s2member_level4)]Please register for PREMIUM VERSION HERE to read full post below containing analysis. In case of any error or you think you are not able to read the full post below, please email us at support#nehcap.com [lwa][/s2If] [s2If current_user_can(access_s2member_level4)]
- AUD/USD regains positive traction in reaction to the upbeat Australian macro data.
- Bets for smaller Fed rate hikes weigh on the USD and remain supportive of the move.
- Bulls might refrain from placing fresh bets ahead of the US CPI report on Thursday.
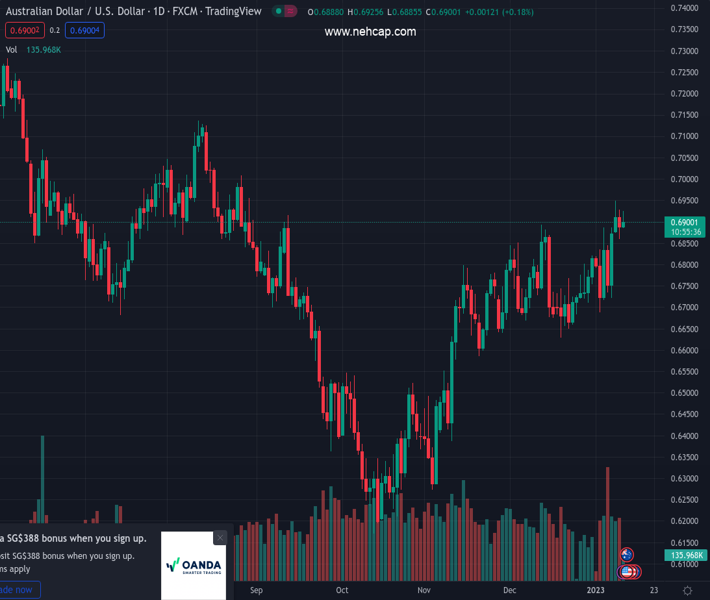
The pair currently trades last at 0.69011.
The previous day high was 0.6928 while the previous day low was 0.686. The daily 38.2% Fib levels comes at 0.6886, expected to provide support. Similarly, the daily 61.8% fib level is at 0.6902, expected to provide resistance.
The AUD/USD pair catches fresh bids on Wednesday and maintains its bid tone through the first half of the European session. The pair is currently placed above the 0.6900 mark and remains well within the striking distance of its highest level since late August touched earlier this week.
The Australian Dollar draws support from the upbeat domestic data, which, along with subdued US Dollar demand, is seen pushing the AUD/USD pair higher. The Australian Bureau of Statistics reported that the headline Consumer Price Index (CPI) re-accelerated to the 7.3% YoY rate – a 32-year-high – in November from the 6.9% in the previous month. Furthermore, Australian Retail Sales surpassed the most optimistic estimates and jumped 1.4% in November to a record A$35.9 billion. Adding to this, October’s reading was also revised up sharply to show a 0.4% growth as compared to the 0.2% drop originally reported. The data lifts the odds for an additional interest rate hike by the Reserve Bank of Australia in February and remains supportive of the intraday positive move.
The US Dollar, on the other hand, struggles to capitalize on the previous day’s bounce from a seven-month low amid firming expectations that the Federal Reserve will soften its hawkish stance. The bets were lifted by last week’s data, which showed that the US wage growth in December and pointed to signs of easing inflationary pressures. Furthermore, business activity in the US services sector contracted and hit the worst level since 2009 in December. This, in turn, reaffirmed expectations for a less aggressive policy tightening by the Fed and keeps the US Treasury bond yields depressed near a multi-week low. Apart from this, a generally positive risk tone undermines the safe-haven greenback and provides an additional lift to the risk-sensitive Aussie.
It, however, remains to be seen if the AUD/USD bulls can retain their dominance or opt to lighten their bets as investors keenly await the release of the US consumer inflation data on Thursday. The crucial US CPI report should provide clarity on whether the Fed will have to increase its target rate beyond 5% to curb stubbornly high inflation. This, in turn, will play a key role in influencing the near-term USD price dynamics. In the meantime, the US bond yields and the broader risk sentiment could drive the USD demand, allowing traders to grab short-term opportunities in the absence of any relevant market-moving economic data from the US on Wednesday.
Technical Levels: Supports and Resistances
AUDUSD currently trading at 0.6909 at the time of writing. Pair opened at 0.6893 and is trading with a change of 0.23 % .
| Overview | Overview.1 | |
|---|---|---|
| 0 | Today last price | 0.6909 |
| 1 | Today Daily Change | 0.0016 |
| 2 | Today Daily Change % | 0.2300 |
| 3 | Today daily open | 0.6893 |
The pair remains strongly bullish on the daily timeframe. It trades above its 20 SMA @ 0.6765, 50 SMA 0.6704, 100 SMA @ 0.6635 and 200 SMA @ 0.6839.
| Trends | Trends.1 | |
|---|---|---|
| 0 | Daily SMA20 | 0.6765 |
| 1 | Daily SMA50 | 0.6704 |
| 2 | Daily SMA100 | 0.6635 |
| 3 | Daily SMA200 | 0.6839 |
The previous day high was 0.6928 while the previous day low was 0.686. The daily 38.2% Fib levels comes at 0.6886, expected to provide support. Similarly, the daily 61.8% fib level is at 0.6902, expected to provide resistance.
Note the levels of interest below:
- Pivot support is noted at 0.6859, 0.6826, 0.6791
- Pivot resistance is noted at 0.6928, 0.6962, 0.6996
| Levels | Levels.1 |
|---|---|
| Previous Daily High | 0.6928 |
| Previous Daily Low | 0.6860 |
| Previous Weekly High | 0.6887 |
| Previous Weekly Low | 0.6688 |
| Previous Monthly High | 0.6893 |
| Previous Monthly Low | 0.6629 |
| Daily Fibonacci 38.2% | 0.6886 |
| Daily Fibonacci 61.8% | 0.6902 |
| Daily Pivot Point S1 | 0.6859 |
| Daily Pivot Point S2 | 0.6826 |
| Daily Pivot Point S3 | 0.6791 |
| Daily Pivot Point R1 | 0.6928 |
| Daily Pivot Point R2 | 0.6962 |
| Daily Pivot Point R3 | 0.6996 |
[/s2If]
Join Our Telegram Group


