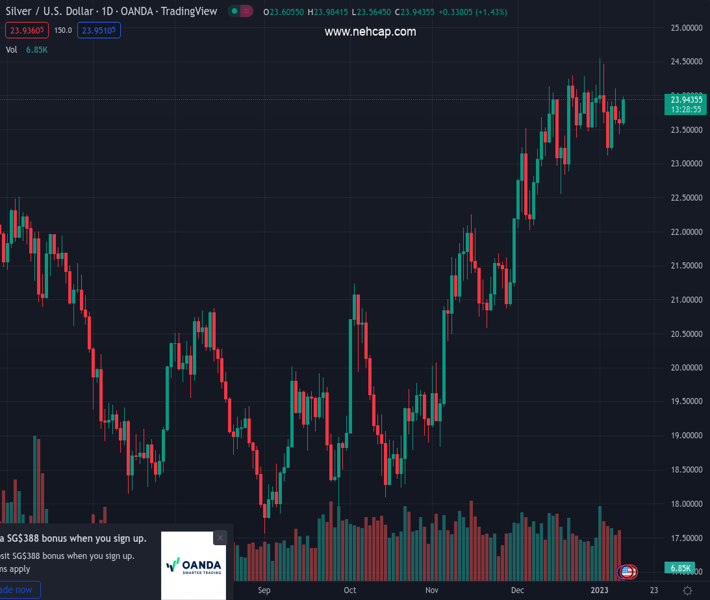
#XAGUSD @ 23.924 Silver catches aggressive bids on Wednesday and snaps a two-day losing streak. (Pivot Orderbook analysis)
…
This is a premium post.
[s2If !current_user_can(access_s2member_level4)]Please register for PREMIUM VERSION HERE to read full post below containing analysis. In case of any error or you think you are not able to read the full post below, please email us at support#nehcap.com [lwa][/s2If] [s2If current_user_can(access_s2member_level4)]
- Silver catches aggressive bids on Wednesday and snaps a two-day losing streak.
- The technical setup supports prospects for a further intraday appreciating move.
- A convincing break below the $23.00 mark is needed to negate the positive bias.
The pair currently trades last at 23.924.
The previous day high was 23.77 while the previous day low was 23.43. The daily 38.2% Fib levels comes at 23.56, expected to provide support. Similarly, the daily 61.8% fib level is at 23.64, expected to provide support.
Silver regains positive traction on Wednesday and reverses its weekly losses recorded over the past two trading sessions. The white metal sticks to its intraday gains through the early European session, with bulls now awaiting a sustained move beyond the $24.00 mark before placing fresh bets.
Meanwhile, technical indicators on the daily chart are still holding in the bullish territory and have been gaining positive traction on hourly charts. This, along with acceptance above the 200-hour SMA, supports prospects for a further near-term appreciating move. Some follow-through buying beyond the $24.00-$24.10 area will reaffirm the constructive setup and pave the way for additional gains.
The XAG/USD might then aim to surpass an intermediate hurdle near the $24.25 zone and accelerate the momentum towards retesting the multi-month high, around the $24.50-$24.55 region touched last week. Some follow-through buying will be seen as a fresh trigger for bullish traders and lift spot prices further towards the $25.00 psychological mark, or the highest level since April 2022.
On the flip side, any meaningful slide back below the 200-hour SMA could attract fresh buyers near the $23.65 horizontal support. This is followed by the overnight swing low, around the $23.45-$23.40 area, below which the XAG/USD could slide to the $23.10-$23.00 support. The latter should act as a base for spot prices, which if broken decisively might shift the bias in favour of bearish traders.
The subsequent downfall has the potential to drag the XAG/USD further towards the $22.60-$22.55 region. The next relevant support is pegged near the $22.10-$22.00 horizontal zone, which if broken decisively will set the stage for an extension of the recent pullback from a multi-month top.
Technical Levels: Supports and Resistances
XAGUSD currently trading at 23.92 at the time of writing. Pair opened at 23.62 and is trading with a change of 1.27 % .
| Overview | Overview.1 | |
|---|---|---|
| 0 | Today last price | 23.92 |
| 1 | Today Daily Change | 0.30 |
| 2 | Today Daily Change % | 1.27 |
| 3 | Today daily open | 23.62 |
The pair remains strongly bullish on the daily timeframe. It trades above its 20 SMA @ 23.69, 50 SMA 22.48, 100 SMA @ 20.8 and 200 SMA @ 21.09.
| Trends | Trends.1 | |
|---|---|---|
| 0 | Daily SMA20 | 23.69 |
| 1 | Daily SMA50 | 22.48 |
| 2 | Daily SMA100 | 20.80 |
| 3 | Daily SMA200 | 21.09 |
The previous day high was 23.77 while the previous day low was 23.43. The daily 38.2% Fib levels comes at 23.56, expected to provide support. Similarly, the daily 61.8% fib level is at 23.64, expected to provide support.
Note the levels of interest below:
- Pivot support is noted at 23.45, 23.27, 23.1
- Pivot resistance is noted at 23.79, 23.95, 24.13
| Levels | Levels.1 |
|---|---|
| Previous Daily High | 23.77 |
| Previous Daily Low | 23.43 |
| Previous Weekly High | 24.55 |
| Previous Weekly Low | 23.12 |
| Previous Monthly High | 24.30 |
| Previous Monthly Low | 22.03 |
| Daily Fibonacci 38.2% | 23.56 |
| Daily Fibonacci 61.8% | 23.64 |
| Daily Pivot Point S1 | 23.45 |
| Daily Pivot Point S2 | 23.27 |
| Daily Pivot Point S3 | 23.10 |
| Daily Pivot Point R1 | 23.79 |
| Daily Pivot Point R2 | 23.95 |
| Daily Pivot Point R3 | 24.13 |
[/s2If]
Join Our Telegram Group


