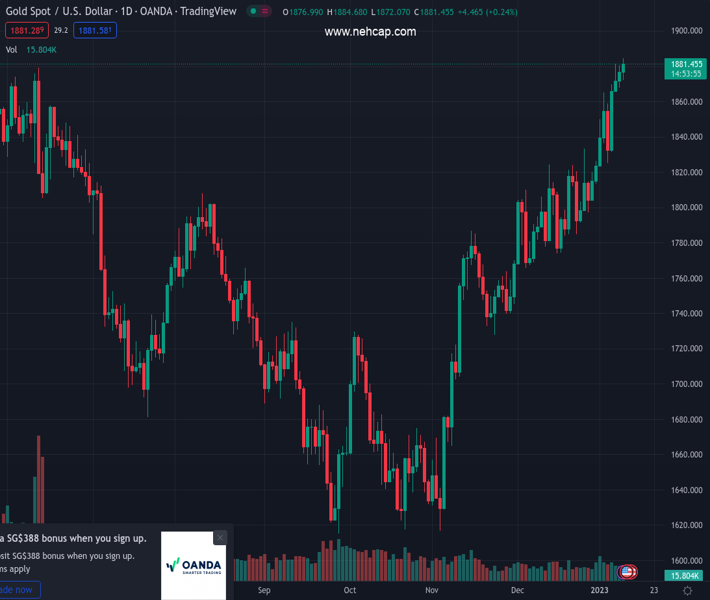
#XAUUSD @ 1,881.63 Gold price rises for the fourth consecutive day amid sluggish markets., @nehcap view: Further upside expected (Pivot Orderbook analysis)
…
This is a premium post.
[s2If !current_user_can(access_s2member_level4)]Please register for PREMIUM VERSION HERE to read full post below containing analysis. In case of any error or you think you are not able to read the full post below, please email us at support#nehcap.com [lwa][/s2If] [s2If current_user_can(access_s2member_level4)]
- Gold price rises for the fourth consecutive day amid sluggish markets.
- Mixed clues, light calendar and pre-data anxiety weigh on the US Dollar.
- Global economic slowdown fears join softer US Dollar to highlight Gold’s traditional haven status.
- Expectations of PBOC rate cut, cautious optimism surrounding China adds strength to the XAU/USD upside.
The pair currently trades last at 1881.63.
The previous day high was 1880.79 while the previous day low was 1867.94. The daily 38.2% Fib levels comes at 1875.88, expected to provide support. Similarly, the daily 61.8% fib level is at 1872.85, expected to provide support.
Gold price (XAU/USD) prints a four-day uptrend as bulls cross the $1,880 resistance to register the highest levels since May 2022 during the early hour of Wednesday’s European session. In doing so, the precious metal cheers broad US Dollar weakness, as well as price-positive headlines from China, to please the buyers despite sluggish market conditions.
That said, the US Dollar Index (DXY) reverses the previous day’s corrective bounce around 103.20, down 0.12% intraday, as Treasury bond yields consolidate the previous day’s gains. That said, the US 10-year Treasury yields rose the most in two weeks on Tuesday but are down 0.90% intraday to 3.59% at the latest.
The recent weakness in the US Dollar and the Treasury bond yields could be linked to the downbeat economic forecasts for the US Consumer Price Index (CPI) up for publishing on Thursday. On the same line, fears of the “soft landing” in the US also weigh on the US Dollar. Furthermore, Fed Chair Jerome Powell’s mum on policy guidance adds strength to the DXY’s bearish bias.
Elsewhere, chatters that the People’s Bank of China (PBOC) will announce rate cuts in 2023 joins the readiness of the dragon nation to offer more stimulus in fueling the Gold price, due to China’s status as one of the world’s biggest commodity users.
Adding strength to the XAU/USD bullish bias could be the traders’ rush toward riskier assets in expectations of softer US inflation data, which in turn allows the US stock futures to print mild gains.
A clear upside break of the 10-month-old horizontal resistance near $1,880 allows the Gold buyers to occupy the driver’s seat amid the bullish MACD signals. Also underpinning the upside bias is the Golden Cross, a condition where 50-DMA crosses the 200-DMA from below and suggests more advances of the underlying.
However, the overbought RSI (14) conditions signal a bumpy road for the XAU/USD towards the north.
That said, the tops marked during May 2022 around $1,910 and late April near $1,920 seem to challenge the short-term Gold buyers.
Following that, a run-up towards the $1,965 hurdle can’t be ruled out, a break of which could easily recall the $2,000 on the XAU/USD chart.
On the contrary, a downside break of $1,880 isn’t necessarily a call to the Gold sellers as the previous resistance line from early October, close to $1,862 by the press time, acts as an extra filter towards the south.
It’s worth noting that the XAU/USD weakness past $1,862 highlights the August 2022 peak surrounding $1,808 as the last defense of the Gold buyers.
Trend: Further upside expected
Technical Levels: Supports and Resistances
XAUUSD currently trading at 1880.8 at the time of writing. Pair opened at 1878.14 and is trading with a change of 0.14% % .
| Overview | Overview.1 | |
|---|---|---|
| 0 | Today last price | 1880.8 |
| 1 | Today Daily Change | 2.66 |
| 2 | Today Daily Change % | 0.14% |
| 3 | Today daily open | 1878.14 |
The pair remains strongly bullish on the daily timeframe. It trades above its 20 SMA @ 1820.22, 50 SMA 1778.04, 100 SMA @ 1729.6 and 200 SMA @ 1777.55.
| Trends | Trends.1 | |
|---|---|---|
| 0 | Daily SMA20 | 1820.22 |
| 1 | Daily SMA50 | 1778.04 |
| 2 | Daily SMA100 | 1729.60 |
| 3 | Daily SMA200 | 1777.55 |
The previous day high was 1880.79 while the previous day low was 1867.94. The daily 38.2% Fib levels comes at 1875.88, expected to provide support. Similarly, the daily 61.8% fib level is at 1872.85, expected to provide support.
Note the levels of interest below:
- Pivot support is noted at 1870.46, 1862.77, 1857.61
- Pivot resistance is noted at 1883.31, 1888.47, 1896.16
| Levels | Levels.1 |
|---|---|
| Previous Daily High | 1880.79 |
| Previous Daily Low | 1867.94 |
| Previous Weekly High | 1869.91 |
| Previous Weekly Low | 1823.76 |
| Previous Monthly High | 1833.38 |
| Previous Monthly Low | 1765.89 |
| Daily Fibonacci 38.2% | 1875.88 |
| Daily Fibonacci 61.8% | 1872.85 |
| Daily Pivot Point S1 | 1870.46 |
| Daily Pivot Point S2 | 1862.77 |
| Daily Pivot Point S3 | 1857.61 |
| Daily Pivot Point R1 | 1883.31 |
| Daily Pivot Point R2 | 1888.47 |
| Daily Pivot Point R3 | 1896.16 |
[/s2If]
Join Our Telegram Group


