#USDCHF @ 0.92147 takes offers to refresh intraday bottom, fades bounce off nine-month low., @nehcap view: Further downside expected (Pivot Orderbook analysis)
…
This is a premium post.
[s2If !current_user_can(access_s2member_level4)]Please register for PREMIUM VERSION HERE to read full post below containing analysis. In case of any error or you think you are not able to read the full post below, please email us at support#nehcap.com [lwa][/s2If] [s2If current_user_can(access_s2member_level4)]
- USD/CHF takes offers to refresh intraday bottom, fades bounce off nine-month low.
- Downside break of weekly support line, bear cross underpin downside bias.
- Recovery moves remain elusive unless crossing 0.9275 hurdle.
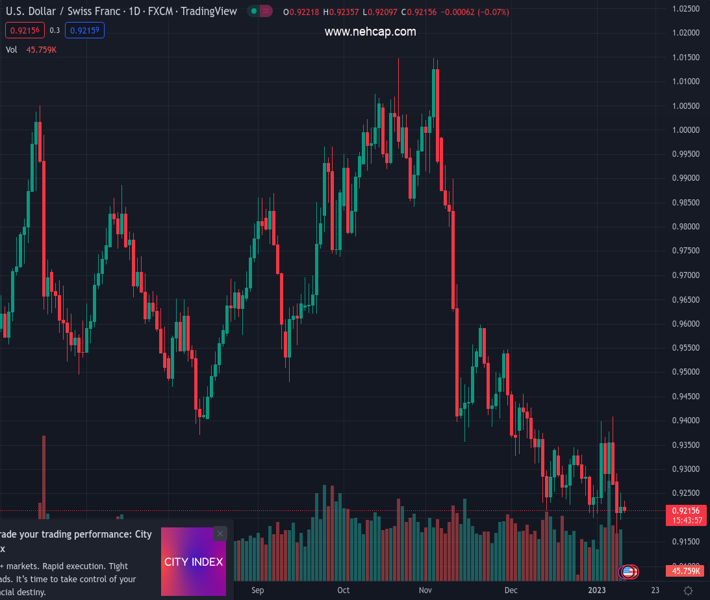
The pair currently trades last at 0.92147.
The previous day high was 0.9252 while the previous day low was 0.9195. The daily 38.2% Fib levels comes at 0.923, expected to provide resistance. Similarly, the daily 61.8% fib level is at 0.9217, expected to provide resistance.
USD/CHF breaks an upward-sloping trend line to welcome bears after the previous day’s brief absence. That said, the Swiss Franc (CHF) pair renews its intraday low around 0.9210 during the early hours of Wednesday morning in Europe.
In addition to the downside break of the two-day-old support line, USD/CHF also cheers bear cross of the key moving averages on the hourly format. The bearish moving average crossover could be witnessed as the 100-Hour Moving Average (HMA) slips beneath the 200-HMA.
It’s worth noting that an absence of oversold RSI also signals a smooth road to the south for the pair sellers.
As a result, the USD/CHF pair is all set to revisit the monthly low surrounding 0.9165, which is also the lowest level since March 2022.
In a case where the bears keep reins past 0.9165, the 0.9100 round figure and the previous yearly low around 0.9090 will gain the market’s attention.
On the contrary, the support-turned-resistance line stretched from Monday, around 0.9230 by the press time, guards immediate recovery of the USD/CHF pair.
Following that, a three-day-old trend line resistance near 0.9255 could test the pair buyers.
However, the USD/CHF bulls may remain cautious unless witnessing a clear upside break of the key HMA convergence surrounding 0.9275.
Trend: Further downside expected
Technical Levels: Supports and Resistances
USDCHF currently trading at 0.9214 at the time of writing. Pair opened at 0.9228 and is trading with a change of -0.15% % .
| Overview | Overview.1 | |
|---|---|---|
| 0 | Today last price | 0.9214 |
| 1 | Today Daily Change | -0.0014 |
| 2 | Today Daily Change % | -0.15% |
| 3 | Today daily open | 0.9228 |
The pair remains strongly bearish on the daily time frame. It trades below the 20 SMA @ 0.9286, 50 SMA 0.9443, 100 SMA @ 0.9635 and 200 SMA @ 0.9644.
| Trends | Trends.1 | |
|---|---|---|
| 0 | Daily SMA20 | 0.9286 |
| 1 | Daily SMA50 | 0.9443 |
| 2 | Daily SMA100 | 0.9635 |
| 3 | Daily SMA200 | 0.9644 |
The previous day high was 0.9252 while the previous day low was 0.9195. The daily 38.2% Fib levels comes at 0.923, expected to provide resistance. Similarly, the daily 61.8% fib level is at 0.9217, expected to provide resistance.
Note the levels of interest below:
- Pivot support is noted at 0.9198, 0.9168, 0.9141
- Pivot resistance is noted at 0.9255, 0.9282, 0.9312
| Levels | Levels.1 |
|---|---|
| Previous Daily High | 0.9252 |
| Previous Daily Low | 0.9195 |
| Previous Weekly High | 0.9410 |
| Previous Weekly Low | 0.9223 |
| Previous Monthly High | 0.9471 |
| Previous Monthly Low | 0.9201 |
| Daily Fibonacci 38.2% | 0.9230 |
| Daily Fibonacci 61.8% | 0.9217 |
| Daily Pivot Point S1 | 0.9198 |
| Daily Pivot Point S2 | 0.9168 |
| Daily Pivot Point S3 | 0.9141 |
| Daily Pivot Point R1 | 0.9255 |
| Daily Pivot Point R2 | 0.9282 |
| Daily Pivot Point R3 | 0.9312 |
[/s2If]
Join Our Telegram Group


