#XAUUSD @ 1,877.61 Gold price has continued to trade sideways further around $1,880.00 as the focus has shifted to US inflation data. (Pivot Orderbook analysis)
…
This is a premium post.
[s2If !current_user_can(access_s2member_level4)]Please register for PREMIUM VERSION HERE to read full post below containing analysis. In case of any error or you think you are not able to read the full post below, please email us at support#nehcap.com [lwa][/s2If] [s2If current_user_can(access_s2member_level4)]
- Gold price has continued to trade sideways further around $1,880.00 as the focus has shifted to US inflation data.
- Only a stronger-than-expected US CPI would avoid a slide to fresh lows for the USD Index.
- Lower wage inflation and weaker PMI numbers have forced Fed policymakers to revise their viewpoint on policy projections.
The pair currently trades last at 1877.61.
The previous day high was 1880.79 while the previous day low was 1867.94. The daily 38.2% Fib levels comes at 1875.88, expected to provide support. Similarly, the daily 61.8% fib level is at 1872.85, expected to provide support.
Gold price (XAU/USD) is struggling to find a direction amid a quiet market mood. The precious metal is oscillating below $1,880.00 as investors are likely to restrict themselves from making significant positions before the release of the United States Consumer Price Index (CPI) data.
The continuous struggle from the US Dollar Index (DXY) in reclaiming the 103.00 resistance is portraying the absence of volatility in the market. Also, S&P500 futures are almost trading flat, holding on to Tuesday’s gains. The 10-year US Treasury yields have slipped below 3.59%.
The USD Index has been beaten down by the market participants after a sheer drop in wage inflation and economic activities, which has forced Federal Reserve (Fed) chair Jerome Powell and his teammates to reconsider their viewpoint over terminal rate projections and the pace of hiking interest rates ahead. Investors will get more clarity after the release of Thursday’s inflation data, which is expected to trim further.
According to the economists at MUFG Bank, only a stronger-than-expected US Consumer Price Index (CPI) on Thursday would avoid a slide to fresh lows for the USD Index.
Gold price is demonstrating an inventory adjustment phase after a firmer rally on an hourly scale. The precious metal might display a decisive move after the release of US inflation data, therefore it is difficult to term it an accumulation or a distribution. The 20-period Exponential Moving Average (EMA) at $1,875.50 is providing support to the Gold bulls. While the 50-EMA at $1,871.90 is still untouched, which indicates that the upside bias is still solid.
The Relative Strength Index (RSI) (14) is oscillating in a 40.00-60.00 range, which indicates an absence of a critical trigger for a decisive action
Technical Levels: Supports and Resistances
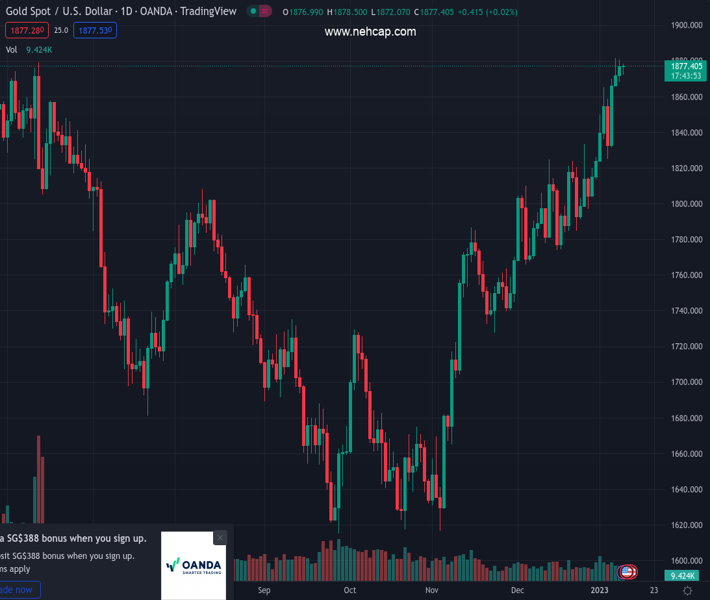
XAUUSD currently trading at 1877.74 at the time of writing. Pair opened at 1878.14 and is trading with a change of -0.02 % .
| Overview | Overview.1 | |
|---|---|---|
| 0 | Today last price | 1877.74 |
| 1 | Today Daily Change | -0.40 |
| 2 | Today Daily Change % | -0.02 |
| 3 | Today daily open | 1878.14 |
The pair remains strongly bullish on the daily timeframe. It trades above its 20 SMA @ 1820.22, 50 SMA 1778.04, 100 SMA @ 1729.6 and 200 SMA @ 1777.55.
| Trends | Trends.1 | |
|---|---|---|
| 0 | Daily SMA20 | 1820.22 |
| 1 | Daily SMA50 | 1778.04 |
| 2 | Daily SMA100 | 1729.60 |
| 3 | Daily SMA200 | 1777.55 |
The previous day high was 1880.79 while the previous day low was 1867.94. The daily 38.2% Fib levels comes at 1875.88, expected to provide support. Similarly, the daily 61.8% fib level is at 1872.85, expected to provide support.
Note the levels of interest below:
- Pivot support is noted at 1870.46, 1862.77, 1857.61
- Pivot resistance is noted at 1883.31, 1888.47, 1896.16
| Levels | Levels.1 |
|---|---|
| Previous Daily High | 1880.79 |
| Previous Daily Low | 1867.94 |
| Previous Weekly High | 1869.91 |
| Previous Weekly Low | 1823.76 |
| Previous Monthly High | 1833.38 |
| Previous Monthly Low | 1765.89 |
| Daily Fibonacci 38.2% | 1875.88 |
| Daily Fibonacci 61.8% | 1872.85 |
| Daily Pivot Point S1 | 1870.46 |
| Daily Pivot Point S2 | 1862.77 |
| Daily Pivot Point S3 | 1857.61 |
| Daily Pivot Point R1 | 1883.31 |
| Daily Pivot Point R2 | 1888.47 |
| Daily Pivot Point R3 | 1896.16 |
[/s2If]
Join Our Telegram Group


