#XAGUSD @ 23.617 Silver price remains depressed below 200-HMA, prints three-day downtrend., @nehcap view: Limited downside expected (Pivot Orderbook analysis)
…
This is a premium post.
[s2If !current_user_can(access_s2member_level4)]Please register for PREMIUM VERSION HERE to read full post below containing analysis. In case of any error or you think you are not able to read the full post below, please email us at support#nehcap.com [lwa][/s2If] [s2If current_user_can(access_s2member_level4)]
- Silver price remains depressed below 200-HMA, prints three-day downtrend.
- Bullish MACD signals, steady RSI can defend buyers around short-term key support.
- Buyers need validation from $24.00 to retake control.
The pair currently trades last at 23.617.
The previous day high was 23.77 while the previous day low was 23.43. The daily 38.2% Fib levels comes at 23.56, expected to provide support. Similarly, the daily 61.8% fib level is at 23.64, expected to provide resistance.
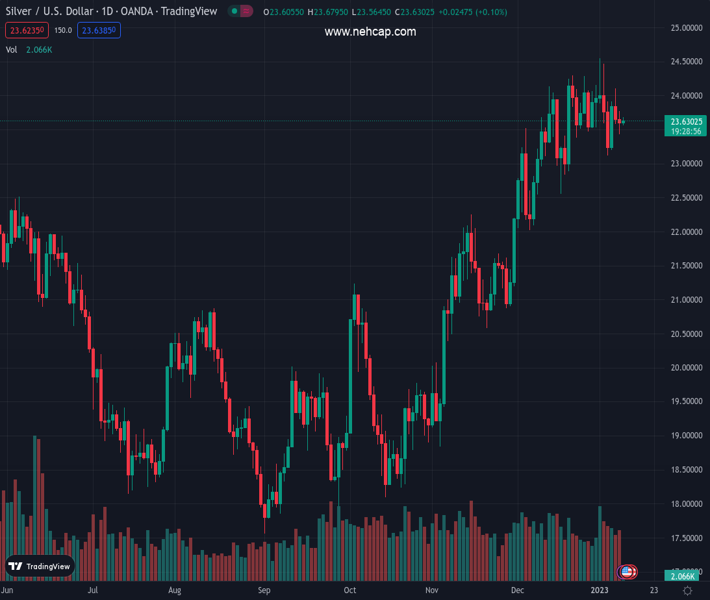
Silver price (XAG/USD) holds lower ground near $23.60 amid early Wednesday’s sluggish markets. In doing so, the bright metal drops for the third consecutive day despite positive mild losses.
That said, the quote’s sustained trading below the 200-Hour Moving Average (HMA) keeps the sellers hopeful. Even so, the bullish MACD signals and mostly steady RSI (14) hint at limited downside room.
As a result, an upward-sloping support line from the last Thursday, around $23.50 by the press time, appears to put a floor under the XAG/USD.
In a case where the Silver sellers manage to conquer the $23.50 support, the monthly low of $23.11 and the $23.00 round figure will gain major attention.
However, the $22.50 appears a tough nut to crack for XAG/USD bears afterward as it comprises the June 2022 peak and late December’s trough.
Meanwhile, an upside clearance of the 200-HMA, close to $23.80 at the latest, isn’t enough for the Silver buyer’s conviction as a downward-sloping resistance line from January 03, close to $23.90, should test the quote’s further advances.
Also acting as an upside hurdle is the $24.00 round figure, a break of which could quickly propel prices towards challenging the monthly high, currently around $24.55.
Trend: Limited downside expected
Technical Levels: Supports and Resistances
XAGUSD currently trading at 23.6 at the time of writing. Pair opened at 23.62 and is trading with a change of -0.08% % .
| Overview | Overview.1 | |
|---|---|---|
| 0 | Today last price | 23.6 |
| 1 | Today Daily Change | -0.02 |
| 2 | Today Daily Change % | -0.08% |
| 3 | Today daily open | 23.62 |
The pair is trading below its 20 Daily moving average @ 23.69, above its 50 Daily moving average @ 22.48 , above its 100 Daily moving average @ 20.8 and above its 200 Daily moving average @ 21.09
| Trends | Trends.1 | |
|---|---|---|
| 0 | Daily SMA20 | 23.69 |
| 1 | Daily SMA50 | 22.48 |
| 2 | Daily SMA100 | 20.80 |
| 3 | Daily SMA200 | 21.09 |
The previous day high was 23.77 while the previous day low was 23.43. The daily 38.2% Fib levels comes at 23.56, expected to provide support. Similarly, the daily 61.8% fib level is at 23.64, expected to provide resistance.
Note the levels of interest below:
- Pivot support is noted at 23.45, 23.27, 23.1
- Pivot resistance is noted at 23.79, 23.95, 24.13
| Levels | Levels.1 |
|---|---|
| Previous Daily High | 23.77 |
| Previous Daily Low | 23.43 |
| Previous Weekly High | 24.55 |
| Previous Weekly Low | 23.12 |
| Previous Monthly High | 24.30 |
| Previous Monthly Low | 22.03 |
| Daily Fibonacci 38.2% | 23.56 |
| Daily Fibonacci 61.8% | 23.64 |
| Daily Pivot Point S1 | 23.45 |
| Daily Pivot Point S2 | 23.27 |
| Daily Pivot Point S3 | 23.10 |
| Daily Pivot Point R1 | 23.79 |
| Daily Pivot Point R2 | 23.95 |
| Daily Pivot Point R3 | 24.13 |
[/s2If]
Join Our Telegram Group


