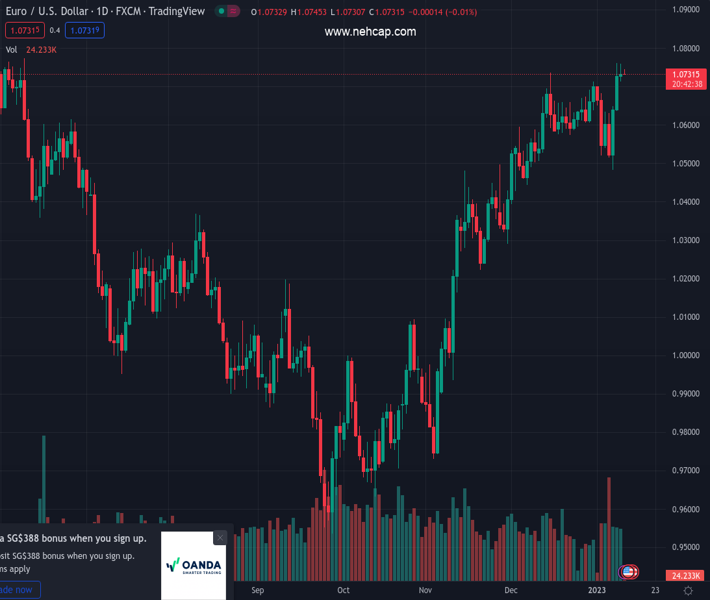
#EURUSD @ 1.07309 picks up bids to reverse the previous day’s pullback inside weekly rectangle formation., @nehcap view: Further upside expected (Pivot Orderbook analysis)
…
This is a premium post.
[s2If !current_user_can(access_s2member_level4)]Please register for PREMIUM VERSION HERE to read full post below containing analysis. In case of any error or you think you are not able to read the full post below, please email us at support#nehcap.com [lwa][/s2If] [s2If current_user_can(access_s2member_level4)]
- EUR/USD picks up bids to reverse the previous day’s pullback inside weekly rectangle formation.
- Short-term ascending trend line, bull cross keeps buyers hopeful amid firmer RSI.
- Late December top adds to the downside filters.
The pair currently trades last at 1.07309.
The previous day high was 1.0759 while the previous day low was 1.0712. The daily 38.2% Fib levels comes at 1.0741, expected to provide resistance. Similarly, the daily 61.8% fib level is at 1.073, expected to provide support.
EUR/USD renews its intraday high around 1.0750 as it extends the day-start recovery during a sluggish mid-Asian session of Wednesday. In doing so, the major currency pair prints mild gains inside a three-day-old rectangle formation.
Even so, the pair’s successful rebound from the weekly support line and firmer RSI (14) keeps the buyers hopeful. Adding strength to the upside bias is the 100-HMA’s crossing of the 200-HMA from below, also known as the bull cross.
As a result, the EUR/USD pair is likely to overcome the 1.0760 immediate hurdle, which in turn could propel prices towards May 2022 peak surrounding 1.0785. However, the 1.0800 round figure and the likely overbought RSI (14) conditions at that level could challenge the pair buyers afterward.
Should the EUR/USD price remains firmer past 1.0800, March 2022 low near 1.0810 could act as the last defense of the sellers before highlighting the 1.1000 psychological magnet for the bulls.
On the flip side, an upward-sloping support line from Monday, around 1.0735 by the press time, restricts immediate EUR/USD downside ahead of the stated rectangle’s bottom, around 1.0710. That said, the tops marked during late December add strength to the 1.0710 support level.
Even if the quote drops below the 1.0710 level, the 100-HMA and the 200-HMA could challenge the pair’s further downside near 1.0645-40.
Trend: Further upside expected
Technical Levels: Supports and Resistances
EURUSD currently trading at 1.0745 at the time of writing. Pair opened at 1.0736 and is trading with a change of 0.08% % .
| Overview | Overview.1 | |
|---|---|---|
| 0 | Today last price | 1.0745 |
| 1 | Today Daily Change | 0.0009 |
| 2 | Today Daily Change % | 0.08% |
| 3 | Today daily open | 1.0736 |
The pair remains strongly bullish on the daily timeframe. It trades above its 20 SMA @ 1.0632, 50 SMA 1.0444, 100 SMA @ 1.0165 and 200 SMA @ 1.0312.
| Trends | Trends.1 | |
|---|---|---|
| 0 | Daily SMA20 | 1.0632 |
| 1 | Daily SMA50 | 1.0444 |
| 2 | Daily SMA100 | 1.0165 |
| 3 | Daily SMA200 | 1.0312 |
The previous day high was 1.0759 while the previous day low was 1.0712. The daily 38.2% Fib levels comes at 1.0741, expected to provide resistance. Similarly, the daily 61.8% fib level is at 1.073, expected to provide support.
Note the levels of interest below:
- Pivot support is noted at 1.0712, 1.0689, 1.0665
- Pivot resistance is noted at 1.076, 1.0783, 1.0807
| Levels | Levels.1 |
|---|---|
| Previous Daily High | 1.0759 |
| Previous Daily Low | 1.0712 |
| Previous Weekly High | 1.0710 |
| Previous Weekly Low | 1.0483 |
| Previous Monthly High | 1.0736 |
| Previous Monthly Low | 1.0393 |
| Daily Fibonacci 38.2% | 1.0741 |
| Daily Fibonacci 61.8% | 1.0730 |
| Daily Pivot Point S1 | 1.0712 |
| Daily Pivot Point S2 | 1.0689 |
| Daily Pivot Point S3 | 1.0665 |
| Daily Pivot Point R1 | 1.0760 |
| Daily Pivot Point R2 | 1.0783 |
| Daily Pivot Point R3 | 1.0807 |
[/s2If]
Join Our Telegram Group


