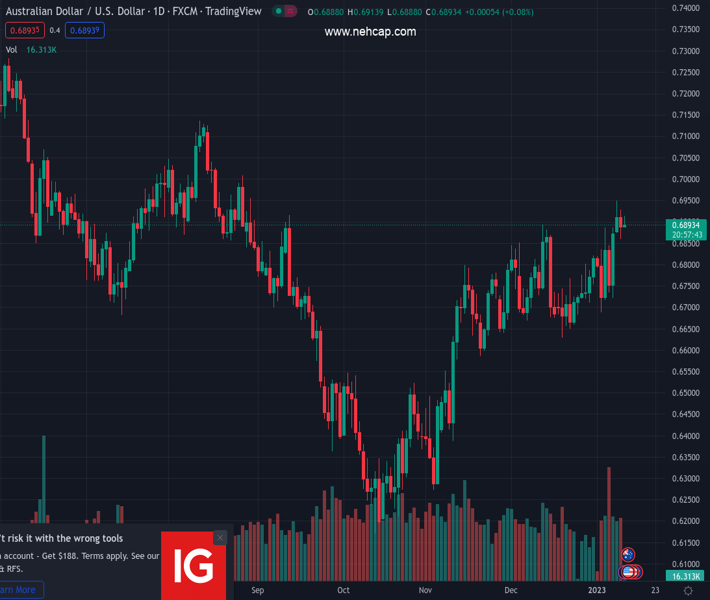
#AUDUSD @ 0.68968 remains mildly bid but fails to cheer strong Aussie data. (Pivot Orderbook analysis)
…
This is a premium post.
[s2If !current_user_can(access_s2member_level4)]Please register for PREMIUM VERSION HERE to read full post below containing analysis. In case of any error or you think you are not able to read the full post below, please email us at support#nehcap.com [lwa][/s2If] [s2If current_user_can(access_s2member_level4)]
- AUD/USD remains mildly bid but fails to cheer strong Aussie data.
- Australia’s Retail Sales, Monthly Consumer Price Index crossed market forecasts and priors in November.
- China inflation numbers are eyed for clear directions ahead of US CPI.
The pair currently trades last at 0.68968.
The previous day high was 0.6928 while the previous day low was 0.686. The daily 38.2% Fib levels comes at 0.6886, expected to provide support. Similarly, the daily 61.8% fib level is at 0.6902, expected to provide resistance.
AUD/USD pierces 0.6900 while printing a small tick towards the north on upbeat Australia data on early Wednesday. The Aussie pair buyers, however, appear cautious ahead of the key China inflation numbers.
Australia’s seasonally adjusted Retail Sales grew 1.4% MoM versus 0.6% expected and -0.2% prior while the Monthly Consumer Price Index rose 7.4% compared to -5.7% market forecasts and -3.9% previous readings.
It’s worth noting that the US Dollar’s failure to keep the previous day’s corrective bounce also underpins the AUD/USD pair’s recovery amid sluggish markets.
That said, the US Dollar Index (DXY) remains pressured towards the 103.00 round figure, around 103.20 by the press time, as it fails to extend Tuesday’s bounce off the seven-month low. In doing so, the greenback traces the downbeat US Treasury yields while also portraying the market’s inaction ahead of the US Consumer Price Index (CPI) data.
US 10-year Treasury bond yields rose 10 basis points (bps) to 3.61%, following a corrective bounce to snap the two-day downtrend marked the previous day. However, the benchmark bond coupons retreat to 3.60% by the press time. The same join the upbeat Wall Street closing to help S&P 500 Futures print mild gains and weigh on the US Dollar’s safe-haven demand.
It should be noted, however, that the downbeat economic forecasts from the World Bank (WB) seem to challenge AUD/USD buyers due to the pair’s risk-barometer status, as well as close ties with China. On Tuesday, The WB stated that it expects the global economy to grow by 1.7% in 2023, down sharply from 3% in June’s forecast, as reported by Reuters. The Washington-based institute also raised fears of global recession by citing the scale of recent slowdowns. Further, “China’s 2022 growth slowed to 2.7% due to COVID lockdowns but will recover to 4.3% for 2023,” stated World Bank, per Reuters.
Looking forward, China’s headline inflation numbers will be crucial for the AUD/USD pair traders ahead of the US Consumer Price Index (CPI), up for publishing on Thursday. Forecasts suggest that China’s CPI is likely to rise to 1.8% YoY versus 1.6% prior while the Producer Price Index (PPI) could improve from -1.3% previous readings to -0.1%. Should the scheduled data match upbeat market forecasts, the AUD/USD may witness further upside, mainly due to its trade ties with China.
AUD/USD bulls remain hopeful of reaching the 0.7000 psychological magnet unless witnessing a daily close below the 200-DMA, at 0.6835 by the press time.
Technical Levels: Supports and Resistances
AUDUSD currently trading at 0.6893 at the time of writing. Pair opened at 0.6893 and is trading with a change of 0.00% % .
| Overview | Overview.1 | |
|---|---|---|
| 0 | Today last price | 0.6893 |
| 1 | Today Daily Change | 0.0000 |
| 2 | Today Daily Change % | 0.00% |
| 3 | Today daily open | 0.6893 |
The pair remains strongly bullish on the daily timeframe. It trades above its 20 SMA @ 0.6765, 50 SMA 0.6704, 100 SMA @ 0.6635 and 200 SMA @ 0.6839.
| Trends | Trends.1 | |
|---|---|---|
| 0 | Daily SMA20 | 0.6765 |
| 1 | Daily SMA50 | 0.6704 |
| 2 | Daily SMA100 | 0.6635 |
| 3 | Daily SMA200 | 0.6839 |
The previous day high was 0.6928 while the previous day low was 0.686. The daily 38.2% Fib levels comes at 0.6886, expected to provide support. Similarly, the daily 61.8% fib level is at 0.6902, expected to provide resistance.
Note the levels of interest below:
- Pivot support is noted at 0.6859, 0.6826, 0.6791
- Pivot resistance is noted at 0.6928, 0.6962, 0.6996
| Levels | Levels.1 |
|---|---|
| Previous Daily High | 0.6928 |
| Previous Daily Low | 0.6860 |
| Previous Weekly High | 0.6887 |
| Previous Weekly Low | 0.6688 |
| Previous Monthly High | 0.6893 |
| Previous Monthly Low | 0.6629 |
| Daily Fibonacci 38.2% | 0.6886 |
| Daily Fibonacci 61.8% | 0.6902 |
| Daily Pivot Point S1 | 0.6859 |
| Daily Pivot Point S2 | 0.6826 |
| Daily Pivot Point S3 | 0.6791 |
| Daily Pivot Point R1 | 0.6928 |
| Daily Pivot Point R2 | 0.6962 |
| Daily Pivot Point R3 | 0.6996 |
[/s2If]
Join Our Telegram Group


