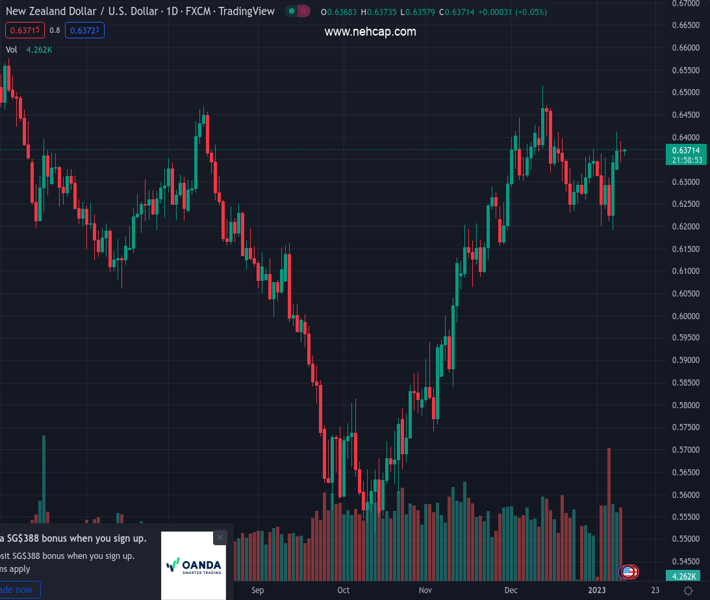
#NZDUSD @ 0.63711 remains sidelined inside a short-term symmetrical triangle formation., @nehcap view: Further upside expected (Pivot Orderbook analysis)
…
This is a premium post.
[s2If !current_user_can(access_s2member_level4)]Please register for PREMIUM VERSION HERE to read full post below containing analysis. In case of any error or you think you are not able to read the full post below, please email us at support#nehcap.com [lwa][/s2If] [s2If current_user_can(access_s2member_level4)]
- NZD/USD remains sidelined inside a short-term symmetrical triangle formation.
- Sustained trading beyond the key HMAs, steady RSI favor buyers.
- Sellers need to break 0.6190 to dominate further.
The pair currently trades last at 0.63711.
The previous day high was 0.6412 while the previous day low was 0.632. The daily 38.2% Fib levels comes at 0.6377, expected to provide resistance. Similarly, the daily 61.8% fib level is at 0.6355, expected to provide support.
NZD/USD makes rounds to 0.6370-75 during early Wednesday, after snapping a two-day uptrend near a monthly top the previous day. In doing so, the Kiwi pair remains inside a symmetrical triangle formation connecting multiple levels marked since Monday.
Not only the immediate triangle but the steady RSI (14) also portrays the Kiwi pair’s latest inaction.
However, the quote’s successful trading above the 100 and 200 Hourly Moving Averages (HMAs) join the above 50 level of RSI to keep the NZD/USD buyers hopeful.
That said, a clear upside break of the stated triangle’s top line, close to 0.6385 by the press time, appears necessary for the bulls to take control.
Even so, the 0.6400 round figure and the recent high surrounding 0.6410 could act as additional upside filters to challenge the buyers before directing them to the previous monthly high near 0.6515. During the run-up, the 0.6500 threshold may act as a buffer.
On the flip side, a downside break of the triangle’s support line, around 0.6345 at the latest, won’t flash a strong bearish signal for the NZD/USD traders as a convergence of the 100 and 200 HMA could restrict the pair’s further downside near 0.6320-15.
Even if the pair drops below 0.6315, the monthly low near 0.6190 may act as the last defense of the NZD/USD buyers.
Trend: Further upside expected
Technical Levels: Supports and Resistances
NZDUSD currently trading at 0.6371 at the time of writing. Pair opened at 0.6372 and is trading with a change of -0.02% % .
| Overview | Overview.1 | |
|---|---|---|
| 0 | Today last price | 0.6371 |
| 1 | Today Daily Change | -0.0001 |
| 2 | Today Daily Change % | -0.02% |
| 3 | Today daily open | 0.6372 |
The pair remains strongly bullish on the daily timeframe. It trades above its 20 SMA @ 0.6329, 50 SMA 0.6224, 100 SMA @ 0.6042 and 200 SMA @ 0.6222.
| Trends | Trends.1 | |
|---|---|---|
| 0 | Daily SMA20 | 0.6329 |
| 1 | Daily SMA50 | 0.6224 |
| 2 | Daily SMA100 | 0.6042 |
| 3 | Daily SMA200 | 0.6222 |
The previous day high was 0.6412 while the previous day low was 0.632. The daily 38.2% Fib levels comes at 0.6377, expected to provide resistance. Similarly, the daily 61.8% fib level is at 0.6355, expected to provide support.
Note the levels of interest below:
- Pivot support is noted at 0.6324, 0.6275, 0.6231
- Pivot resistance is noted at 0.6416, 0.646, 0.6509
| Levels | Levels.1 |
|---|---|
| Previous Daily High | 0.6412 |
| Previous Daily Low | 0.6320 |
| Previous Weekly High | 0.6363 |
| Previous Weekly Low | 0.6190 |
| Previous Monthly High | 0.6514 |
| Previous Monthly Low | 0.6230 |
| Daily Fibonacci 38.2% | 0.6377 |
| Daily Fibonacci 61.8% | 0.6355 |
| Daily Pivot Point S1 | 0.6324 |
| Daily Pivot Point S2 | 0.6275 |
| Daily Pivot Point S3 | 0.6231 |
| Daily Pivot Point R1 | 0.6416 |
| Daily Pivot Point R2 | 0.6460 |
| Daily Pivot Point R3 | 0.6509 |
[/s2If]
Join Our Telegram Group


