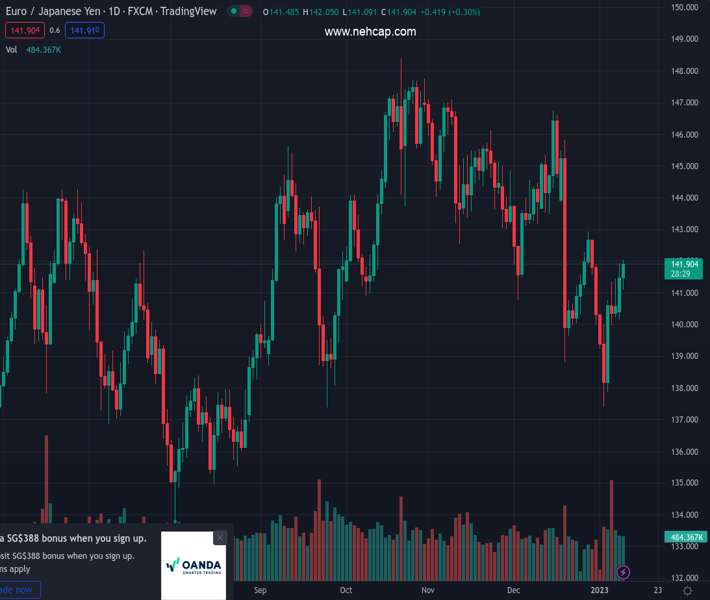
#EURJPY @ 141.901 climbs but stalls around 142.00, the confluence of the figure and the 100-DMA (Pivot Orderbook analysis)
…
This is a premium post.
[s2If !current_user_can(access_s2member_level4)]Please register for PREMIUM VERSION HERE to read full post below containing analysis. In case of any error or you think you are not able to read the full post below, please email us at support#nehcap.com [lwa][/s2If] [s2If current_user_can(access_s2member_level4)]
- EUR/JPY climbs but stalls around 142.00, the confluence of the figure and the 100-DMA
- The EUR/JPY would be bullish above 142.00; otherwise, it could plunge towards 141.00.
The pair currently trades last at 141.901.
The previous day high was 141.92 while the previous day low was 140.16. The daily 38.2% Fib levels comes at 141.25, expected to provide support. Similarly, the daily 61.8% fib level is at 140.84, expected to provide support.
EUR/JPY extends its gains to three consecutive trading days, up by 0.38%, as Wall Street finished Tuesday’s session with solid gains. On its way toward two-week new highs, the EUR/JPY cleared the 20-day Exponential Moving Average (EMA) at 141.53 and is poised to test the 100-day EMA at 142.22. At press time, the EUR/JPY is trading at 141.97.
The cross-currency pair daily chart suggests that buyers remain in charge after clearing the 200-day EMA on January 4, at around 140.16. To continue its uptrend, the EUR/JPY needs to reclaim the 142.00 figure, even though it would face solid resistance around the 100-day EMA. If the EUR/JPY breaks the latter, that will clear the way toward the 50-day EMA at 142.50, followed by the 143.00 mark.
However, if the EUR/JPY’s rally stalls at 142.00, tha can set the pair towards testing the 20-day EMA on the downside around 141.53. Once cleared, the EUR/JPY will slide towards 141.00, followed by a challenge of the 200-day EMA at 140.20.
Technical Levels: Supports and Resistances
EURJPY currently trading at 142.0 at the time of writing. Pair opened at 141.44 and is trading with a change of 0.4 % .
| Overview | Overview.1 | |
|---|---|---|
| 0 | Today last price | 142.00 |
| 1 | Today Daily Change | 0.56 |
| 2 | Today Daily Change % | 0.40 |
| 3 | Today daily open | 141.44 |
The pair is trading above its 20 Daily moving average @ 141.78, below its 50 Daily moving average @ 143.44 , below its 100 Daily moving average @ 142.97 and above its 200 Daily moving average @ 140.59
| Trends | Trends.1 | |
|---|---|---|
| 0 | Daily SMA20 | 141.78 |
| 1 | Daily SMA50 | 143.44 |
| 2 | Daily SMA100 | 142.97 |
| 3 | Daily SMA200 | 140.59 |
The previous day high was 141.92 while the previous day low was 140.16. The daily 38.2% Fib levels comes at 141.25, expected to provide support. Similarly, the daily 61.8% fib level is at 140.84, expected to provide support.
Note the levels of interest below:
- Pivot support is noted at 140.43, 139.42, 138.68
- Pivot resistance is noted at 142.18, 142.93, 143.94
| Levels | Levels.1 |
|---|---|
| Previous Daily High | 141.92 |
| Previous Daily Low | 140.16 |
| Previous Weekly High | 141.45 |
| Previous Weekly Low | 137.39 |
| Previous Monthly High | 146.73 |
| Previous Monthly Low | 138.80 |
| Daily Fibonacci 38.2% | 141.25 |
| Daily Fibonacci 61.8% | 140.84 |
| Daily Pivot Point S1 | 140.43 |
| Daily Pivot Point S2 | 139.42 |
| Daily Pivot Point S3 | 138.68 |
| Daily Pivot Point R1 | 142.18 |
| Daily Pivot Point R2 | 142.93 |
| Daily Pivot Point R3 | 143.94 |
[/s2If]
Join Our Telegram Group


