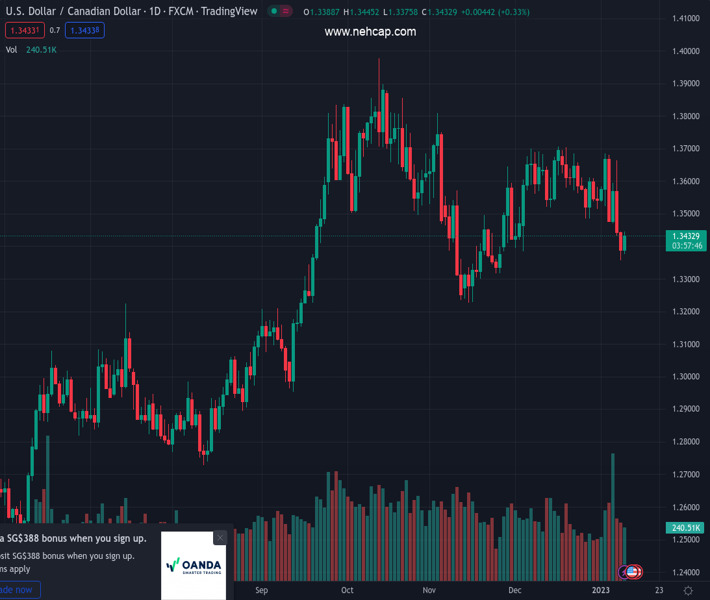
#USDCAD @ 1.34358 struggles for direction as the US Dollar rises, while oil prices capped the upside. (Pivot Orderbook analysis)
…
This is a premium post.
[s2If !current_user_can(access_s2member_level4)]Please register for PREMIUM VERSION HERE to read full post below containing analysis. In case of any error or you think you are not able to read the full post below, please email us at support#nehcap.com [lwa][/s2If] [s2If current_user_can(access_s2member_level4)]
- USD/CAD struggles for direction as the US Dollar rises, while oil prices capped the upside.
- US Treasury bond yields spurred the uptick in the US Dollar, keeping the USD/CAD above its 20-DMA.
- Thursday’s US Consumer Price Index (CPI) and Jobless Claims would provide fresh impetus to USD/CAD traders.
The pair currently trades last at 1.34358.
The previous day high was 1.3446 while the previous day low was 1.3357. The daily 38.2% Fib levels comes at 1.3391, expected to provide support. Similarly, the daily 61.8% fib level is at 1.3412, expected to provide support.
The USD/CAD registers minuscule losses in the mid-North American session after hitting a daily low of 1.3357. Market sentiment remains fragile, fluctuating, while a late bid in the US Dollar (USD) spurred a jump in the USD/CAD pair. At the time of writing, the USD/CAD is trading at 1.3424, slightly down by 0.14%.
US equities are seesawing amidst a mixed mood. The greenback is pairing some of its losses, according to the US Dollar Index (DXY), which measures the buck’s performance against a basket of peers, up 0.11%, at 103.281, underpinned by high US bond yields. The US 10-year benchmark note rate is climbing nine bps, to 3.630%, after US Federal Reserve (Fed) Chief Jerome Powell’s speech did not acknowledge the monetary policy.
Of late, Federal Reserve Governor Michell Bowman said that continued rate hikes are needed to curb inflation. She added that she’s looking for “convincing evidence” that inflation has peaked and that incoming data will influence her view on the size of interest rate hikes.
On the Canadian side, a staggering labor market report last Friday increased the likelihood of a 25 bps rate hike, according to TD Securities analysts. “Today’s report leaves the Bank of Canada in an uncomfortable position.” They added that deceleration in wages would not satisfy Bank of Canada’s (BoC) policymakers and stated, “we now look for the Bank to hike another 25bps to 4.50% in January. We expect that 4.50% will be the BoC’s terminal rate for this cycle.”
In the meantime, a jump in crude oil prices is putting a lid on the USD/CAD recovery as WTI climbs 0.86%, exchanging hands around $75.44 per barrel.
Ahead of the week, the US economic docket will feature the release of the Consumer Price Index (CPI) for December, alongside unemployment claims, on Thursday. An absent Canadian economic calendar would leave USD/CAD traders adrift to US Dollar dynamics.
Technical Levels: Supports and Resistances
USDCAD currently trading at 1.3427 at the time of writing. Pair opened at 1.3389 and is trading with a change of 0.28 % .
| Overview | Overview.1 | |
|---|---|---|
| 0 | Today last price | 1.3427 |
| 1 | Today Daily Change | 0.0038 |
| 2 | Today Daily Change % | 0.2800 |
| 3 | Today daily open | 1.3389 |
The pair is trading below its 20 Daily moving average @ 1.3576, below its 50 Daily moving average @ 1.3517 , below its 100 Daily moving average @ 1.3479 and above its 200 Daily moving average @ 1.3152
| Trends | Trends.1 | |
|---|---|---|
| 0 | Daily SMA20 | 1.3576 |
| 1 | Daily SMA50 | 1.3517 |
| 2 | Daily SMA100 | 1.3479 |
| 3 | Daily SMA200 | 1.3152 |
The previous day high was 1.3446 while the previous day low was 1.3357. The daily 38.2% Fib levels comes at 1.3391, expected to provide support. Similarly, the daily 61.8% fib level is at 1.3412, expected to provide support.
Note the levels of interest below:
- Pivot support is noted at 1.3349, 1.3308, 1.326
- Pivot resistance is noted at 1.3438, 1.3486, 1.3527
| Levels | Levels.1 |
|---|---|
| Previous Daily High | 1.3446 |
| Previous Daily Low | 1.3357 |
| Previous Weekly High | 1.3685 |
| Previous Weekly Low | 1.3433 |
| Previous Monthly High | 1.3705 |
| Previous Monthly Low | 1.3385 |
| Daily Fibonacci 38.2% | 1.3391 |
| Daily Fibonacci 61.8% | 1.3412 |
| Daily Pivot Point S1 | 1.3349 |
| Daily Pivot Point S2 | 1.3308 |
| Daily Pivot Point S3 | 1.3260 |
| Daily Pivot Point R1 | 1.3438 |
| Daily Pivot Point R2 | 1.3486 |
| Daily Pivot Point R3 | 1.3527 |
[/s2If]
Join Our Telegram Group


