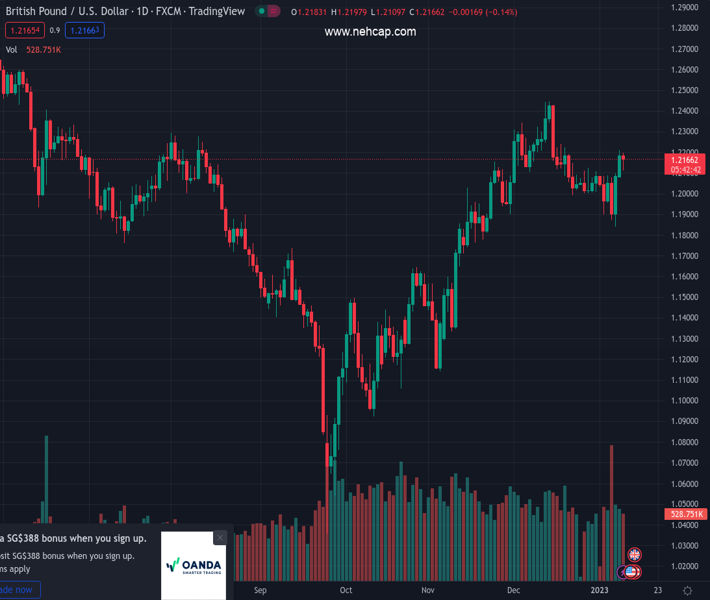
#GBPUSD @ 1.21639 registers some decent losses after failing to climb above 1.2200. (Pivot Orderbook analysis)
…
This is a premium post.
[s2If !current_user_can(access_s2member_level4)]Please register for PREMIUM VERSION HERE to read full post below containing analysis. In case of any error or you think you are not able to read the full post below, please email us at support#nehcap.com [lwa][/s2If] [s2If current_user_can(access_s2member_level4)]
- GBP/USD registers some decent losses after failing to climb above 1.2200.
- For the GBP/USD to extend its gains, it needs to reclaim 1.2200, to pose a challenge of 1.2300.
The pair currently trades last at 1.21639.
The previous day high was 1.221 while the previous day low was 1.2086. The daily 38.2% Fib levels comes at 1.2163, expected to provide support. Similarly, the daily 61.8% fib level is at 1.2134, expected to provide support.
The Pound Sterling (GBP) trims some of its Monday gains vs. the US Dollar (USD), drops below 1.2200, and aims toward the 1.2150 area after hitting a daily high at around 1.2197. Hence, the GBP/USD falls 0.17% and is trading at 1.2161.
On Tuesday, the GBP/USD is edging toward the 200-day Exponential Moving Average (EMA) at 1.2107 after failing to decisively crack the 1.2200 figure. Oscillators like the Relative Strength Index (RSI) and the Rate of Change (RoC) suggest that buying pressure is easing. So, chances of the GBP/USD’s testing the 200-day EMA, albeit slim, remain.
For that scenario to play out, the GBP/USD needs further to extend its losses and clear the 200-day EMA. Once done, the next hurdle would be 1.2100, followed by the 20-day EMA at 1.2074, and then the 1.2000 mark.
Otherwise, if the GBP/USD turns positive, the first resistance would be the 1.2200 mark. A breach of the latter will expose the December 19 daily high of 1.2242, followed by the 1.2300 mark.
Technical Levels: Supports and Resistances
GBPUSD currently trading at 1.2148 at the time of writing. Pair opened at 1.218 and is trading with a change of -0.26 % .
| Overview | Overview.1 | |
|---|---|---|
| 0 | Today last price | 1.2148 |
| 1 | Today Daily Change | -0.0032 |
| 2 | Today Daily Change % | -0.2600 |
| 3 | Today daily open | 1.2180 |
The pair remains strongly bullish on the daily timeframe. It trades above its 20 SMA @ 1.2106, 50 SMA 1.1971, 100 SMA @ 1.1673 and 200 SMA @ 1.2014.
| Trends | Trends.1 | |
|---|---|---|
| 0 | Daily SMA20 | 1.2106 |
| 1 | Daily SMA50 | 1.1971 |
| 2 | Daily SMA100 | 1.1673 |
| 3 | Daily SMA200 | 1.2014 |
The previous day high was 1.221 while the previous day low was 1.2086. The daily 38.2% Fib levels comes at 1.2163, expected to provide support. Similarly, the daily 61.8% fib level is at 1.2134, expected to provide support.
Note the levels of interest below:
- Pivot support is noted at 1.2108, 1.2035, 1.1984
- Pivot resistance is noted at 1.2231, 1.2283, 1.2355
| Levels | Levels.1 |
|---|---|
| Previous Daily High | 1.2210 |
| Previous Daily Low | 1.2086 |
| Previous Weekly High | 1.2102 |
| Previous Weekly Low | 1.1841 |
| Previous Monthly High | 1.2447 |
| Previous Monthly Low | 1.1992 |
| Daily Fibonacci 38.2% | 1.2163 |
| Daily Fibonacci 61.8% | 1.2134 |
| Daily Pivot Point S1 | 1.2108 |
| Daily Pivot Point S2 | 1.2035 |
| Daily Pivot Point S3 | 1.1984 |
| Daily Pivot Point R1 | 1.2231 |
| Daily Pivot Point R2 | 1.2283 |
| Daily Pivot Point R3 | 1.2355 |
[/s2If]
Join Our Telegram Group


