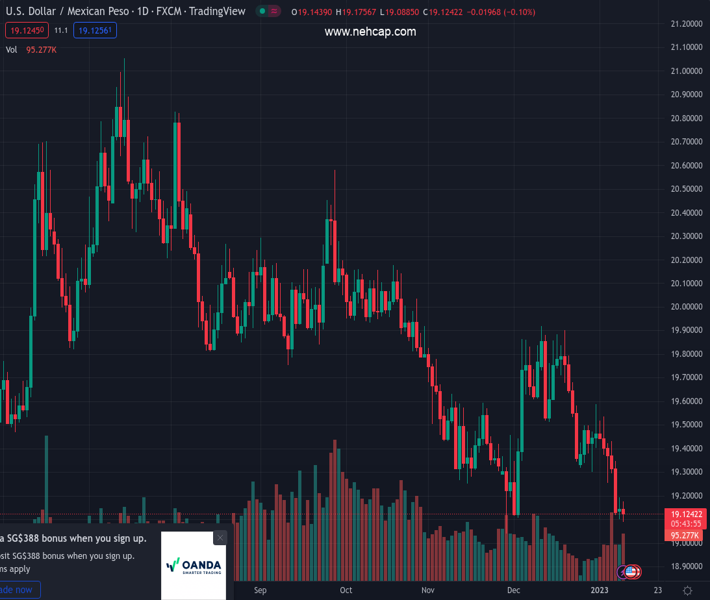
#USDMXN @ 19.1259 US Dollar remains weak against Emerging Markets currencies. (Pivot Orderbook analysis)
…
This is a premium post.
[s2If !current_user_can(access_s2member_level4)]Please register for PREMIUM VERSION HERE to read full post below containing analysis. In case of any error or you think you are not able to read the full post below, please email us at support#nehcap.com [lwa][/s2If] [s2If current_user_can(access_s2member_level4)]
- US Dollar remains weak against Emerging Markets currencies.
- USD/MXN testing 2022 lows near 19.10, closer to 19.00.
The pair currently trades last at 19.1259.
The previous day high was 19.1951 while the previous day low was 19.1015. The daily 38.2% Fib levels comes at 19.1593, expected to provide resistance. Similarly, the daily 61.8% fib level is at 19.1373, expected to provide resistance.
The USD/MXN is falling again on Tuesday as it continues to move with a bearish bias, approaching the 19.00 psychological area. Earlier today it bottomed at 19.08, the lowest level in a month and slightly above the 2022 low it hit in November.
The bias is bearish in USD/MXN but it is facing a strong resistance area between 19.10 and 19.00. Technical indicators are near oversold readings which could suggest some consolidation ahead before a break lower. A candidate for the range is the 19.00-19.30 band or a wider one between 19.00 and 19.50.
The strength of the Mexican Peso is likely to remain intact while USD/MXN trades under 19.50. The initial resistance level is seen at 19.30. Then comes the 20-day Simple Moving Average, currently at 19.47 and then the 19.50 area. A break above 19.60 would point to more gains for the US Dollar, targeting 19.80.
Technical Levels: Supports and Resistances
USDMXN currently trading at 19.1226 at the time of writing. Pair opened at 19.1429 and is trading with a change of -0.11 % .
| Overview | Overview.1 | |
|---|---|---|
| 0 | Today last price | 19.1226 |
| 1 | Today Daily Change | -0.0203 |
| 2 | Today Daily Change % | -0.1100 |
| 3 | Today daily open | 19.1429 |
The pair remains strongly bearish on the daily time frame. It trades below the 20 SMA @ 19.4984, 50 SMA 19.4936, 100 SMA @ 19.7578 and 200 SMA @ 19.9604.
| Trends | Trends.1 | |
|---|---|---|
| 0 | Daily SMA20 | 19.4984 |
| 1 | Daily SMA50 | 19.4936 |
| 2 | Daily SMA100 | 19.7578 |
| 3 | Daily SMA200 | 19.9604 |
The previous day high was 19.1951 while the previous day low was 19.1015. The daily 38.2% Fib levels comes at 19.1593, expected to provide resistance. Similarly, the daily 61.8% fib level is at 19.1373, expected to provide resistance.
Note the levels of interest below:
- Pivot support is noted at 19.0979, 19.0529, 19.0044
- Pivot resistance is noted at 19.1915, 19.24, 19.285
| Levels | Levels.1 |
|---|---|
| Previous Daily High | 19.1951 |
| Previous Daily Low | 19.1015 |
| Previous Weekly High | 19.5361 |
| Previous Weekly Low | 19.1202 |
| Previous Monthly High | 19.9181 |
| Previous Monthly Low | 19.1084 |
| Daily Fibonacci 38.2% | 19.1593 |
| Daily Fibonacci 61.8% | 19.1373 |
| Daily Pivot Point S1 | 19.0979 |
| Daily Pivot Point S2 | 19.0529 |
| Daily Pivot Point S3 | 19.0044 |
| Daily Pivot Point R1 | 19.1915 |
| Daily Pivot Point R2 | 19.2400 |
| Daily Pivot Point R3 | 19.2850 |
[/s2If]
Join Our Telegram Group


